

Ivaylo I. Alexandrov, Violeta R. Manolova and Stoyan R. Vezenkov
Center for applied neuroscience Vezenkov, BG-1582 Sofia, e-mail: info@vezenkov.com
For citation: Alexandrov, I.I., Manolova V.R. and Vezenkov, S.R. (2025) Integrative Biofeedback Therapy in a Treatment-Resistant Schizophrenia Case with Screen Addiction: Insights from qEEG and HRV. Nootism 1(4), 25-37; https://doi.org/10.64441/
Abstract
Excessive screen exposure in youth is increasingly recognized as a contributing factor in complex psychiatric presentations, often intertwined with developmental trauma and misdiagnosis within the schizophrenia spectrum. This case study presents the nine-month neurotherapy treatment of a 26-year-old male with a long-standing history of social withdrawal, obsessive-compulsive behaviors, and treatment resistance despite years of pharmacological and psychotherapeutic interventions. Early relational trauma, emotional neglect, and prolonged digital isolation were central elements in the clinical background.
Pre- and post-intervention assessments included quantitative electroencephalography (qEEG), heart rate variability (HRV), and clinical observation. Biofeedback sessions were conducted weekly using a multimodal platform targeting autonomic regulation, attentional control, and cortical balance. Throughout therapy, a structured reduction in screen time was gradually implemented with the support of the caregiver.
Following the intervention, qEEG data revealed significant neurophysiological changes, including reduced excessive theta and alpha power, normalization of alpha activity, interhemispheric asymmetry, and coherence. HRV metrics demonstrated increased vagal tone, improved sympathetic balance, and decreased physiological stress indices. These physiological shifts were accompanied by marked behavioral improvements: emotional re-engagement, renewed musical interest, increased humor and interaction, and improved ability to process written information.
The case demonstrates that meaningful clinical change in screen-affected individuals requires more than symptom-based psychiatric diagnosis and medication. Neurotherapy combined with screen time regulation enabled a reversal of dissociative patterns and restored self-regulation. The findings support a trauma-informed, ecological model of care, where screen addictive behavior is seen as both a symptom and a therapeutic target. Addressing screen addiction is essential for achieving durable therapeutic outcomes in similar clinical profiles.
Keywords: schizophrenia; screen addiction; trauma; treatment resistance; biofeedback; quantitative EEG (qEEG); heart rate variability (HRV); functional connectivity, coherence
Introduction
Screen addiction is increasingly recognized as a distinct clinical entity with identifiable neurophysiological, behavioral, and developmental markers. In our recent foundational study, we identified a cluster of specific biomarkers – such as altered heart rate variability (HRV), slowing down the cortical activity; reversed hemispheric asymmetry, with dominant alpha and/or theta rhythms in the left hemisphere; increased neural coherence, and pathological sensorimotor reflexes – in children and adolescents with early and prolonged screen addiction (Vezenkov & Manolova, 2025a; 2025b; 2025c). We also documented the profound developmental damage associated with the addiction, including delayed language acquisition, impaired executive functioning, and emotional flattening, named it screen trauma (Manolova & Vezenkov, 2025a). These findings support the view that screen addiction should be addressed as a primary disorder in its own right, rather than as a secondary manifestation of broader psychiatric diagnoses.
Accumulating evidence from our clinical case studies indicates that persistent screen overuse in children and young adults is frequently intertwined with histories of early developmental trauma, misdiagnosis of psychiatric conditions, and resistance to standard pharmacological interventions (Ivanova et al., 2025; Mateev et al., 2025). In several documented cases, what appeared diagnostically as autism spectrum disorder or early-onset schizophrenia was instead closely linked to screen-induced behavioral and neurophysiological distortions. (Vezenkov & Manolova, 2025d) Notably, we have demonstrated that dissociative states, sensory overstimulation, and rigid cue-dependent behavioral patterns – often induced by screen addiction – can mimic or amplify core symptoms typically attributed to schizophrenia spectrum or autism spectrum disorders (Manolova & Vezenkov, 2025b; Vezenkov & Manolova, 2025a, 2025d). These findings raise critical concerns about diagnostic overshadowing and emphasize the importance of addressing screen addiction as an independent and etiologically distinct condition.
Furthermore, parental dynamics and unresolved trauma within the family system appear to play a pivotal role in both the onset and maintenance of screen addiction (Manolova, et al., 2025; Petrov et al., 2025). As our group has previously shown, targeted biofeedback-based neurotherapy can support reintegration of sensorimotor coherence and gradually restore emotional responsiveness in children and adolescents with severe screen addiction (Vezenkov & Manolova, 2024; Pashina et al., 2025).
This paper presents the therapeutic trajectory of a 26-year-old male patient with a history of screen addiction, social isolation, and multiple psychiatric diagnoses. The case illustrates the importance of combining biofeedback neurotherapy with family involvement and structured screen reduction protocols. A multimodal assessment protocol including qEEG and HRV markers was used to evaluate therapeutic outcomes.
Case Description
В., a 26-year-old male, was brought to our Center by his mother in hopes of achieving change after years of unsuccessful pharmacological and psychotherapeutic interventions. His mother is a professional actress; his father is a professional classical musician. B. has a younger sister who is also an adult.
The patient’s early life was marked by ongoing physical and emotional abuse within the family. His father exerted violence both toward his mother and toward B., including slapping and, on one occasion, hitting him with a stick. B. rarely showed emotional expression in response to this abuse and reportedly cried only once – when he was falsely accused by his father.
Significant psychological difficulties began to manifest during B.’s transition to high school at the age of 14. During the first two months of his first year, he ceased attending classes altogether, a fact that his mother discovered only after being contacted by his homeroom teacher. He was subsequently transferred to an individualized educational program for the remainder of the academic year, which he completed with relatively positive teacher feedback.
During the summer that followed, the family environment further deteriorated with escalating conflicts, culminating in the separation of the parents. His second year of high school was completed through a self-directed learning format, as B. remained alone at home for most of the day. This period marked the beginning of a sharp increase in screen time. Upon turning 18, he officially dropped out of school and fully withdrew from formal education. Simultaneously, his screen addiction deepened, and he began retreating from all daily activities, eventually reaching a state of total social isolation.
At age 19, B. experienced his first panic attacks, along with early signs of obsessive-compulsive behaviors, such as passing through specific spaces in particular ways and frequent hand washing – limited exclusively to the home environment. He justified these rituals vaguely, stating, “I’m protecting myself from something… I know what it is.” An attempt by his father to re-enroll him in evening school triggered an intense emotional outburst; B. protested violently, refusing to engage with education. His father, in turn, lost his temper, and the interaction escalated into a conflict. From that moment on, B. began quietly repeating to himself, especially when anxious, one of his father’s statements: “You brought this on yourself.”
Psychiatric History and Pharmacological Treatment
Following the escalation of conflict with his father, B.’s family sought psychiatric consultation. The first psychiatrist – without conducting any formal testing – diagnosed him with either schizoid or paranoid personality disorder and prescribed 5 mg of olanzapine. This resulted in excessive sedation, with B. sleeping between 14 and 16 hours per day. At that point, B. was 20 years old (late 2018).
A second psychiatrist, again without administering any psychometric or neurophysiological assessments, diagnosed B. with paranoid schizophrenia. The olanzapine dosage was increased and amisulpride (commercially known as Medosulpiride) was added to the regimen.
The resulting pharmacological scheme was as follows:
- Morning: 10 mg olanzapine + 400 mg amisulpride
- Midday: 10 mg olanzapine + 400 mg amisulpride
- Evening: 20 mg olanzapine
Despite several months of adherence to this intensive medication protocol, no clinically meaningful improvement was observed. While B. appeared outwardly calm, his mother reported that he seemed emotionally vacant – disconnected from his own thoughts and feelings. He would periodically ask, “When will I get better?”, but expressed no concrete vision for the future or personal recovery.
At his mother’s suggestion, B. agreed without resistance to begin psychotherapy, demonstrating a rare moment of openness and trust. This therapeutic process continued from 2020 to 2024.
In 2021, after losing contact with the supervising psychiatrist, the mother sought a third psychiatric opinion. Once again, in the absence of diagnostic testing, olanzapine was discontinued and clozapine (commercial name: Leponex) was introduced, gradually titrated to 300 mg daily.
The revised medication schedule became:
- Morning: 400 mg amisulpride
- Midday: 100 mg clozapine + 400 mg amisulpride
- Evening: 200 mg clozapine
The psychiatrist assured B. that this treatment would eliminate “the voice” he occasionally referenced. However, his mother clarified that this so-called auditory hallucination was speculative. According to her, B. had only ever described an internal “pressure,” which – when prompted – he acknowledged was similar to a voice. She questioned whether this might instead reflect intrusive memories of actual verbal abuse rather than psychotic symptoms.
Two months prior to initiating neurotherapy, all psychiatric medications were gradually tapered under supervision. This was done without triggering any acute withdrawal symptoms, although no positive clinical changes were noted either.
At the start of neurotherapy, B.’s current medication regimen was:
- Morning: 200 mg amisulpride
- Midday: 200 mg amisulpride
- Evening: 50 mg clozapine
In parallel, a number of nutritional supplements were introduced: Ashwagandha, L-theanine, selenium, and Ginkgo biloba.
Cognitive difficulties – including impaired comprehension, sustained attention deficits, and markedly reduced concentration – had been present since age 18. His ability to process and retain written material had remained severely compromised despite repeated efforts to stimulate learning.
Methods
Study Design
A pre- and post-intervention assessment protocol was implemented to evaluate the therapeutic effects. The evaluation included three key components: (1) a semi-structured clinical interview, (2) quantitative electroencephalography (qEEG), and (3) multimodal assessment of peripheral autonomic nervous system (ANS) activity.
Quantitative EEG (qEEG) Assessment
Electroencephalographic recordings were conducted using a 19-channel monopolar montage with the Neuron-Spectrum-4P system and Neuron-Spectrum.NET software (Neurosoft LLC, Russia). Quantitative spectral analysis – including the computation of absolute and relative amplitude across standard EEG frequency bands, as well as coherence and phase lag metrics – was carried out within the Neuron-Spectrum.NET environment. For normative comparison, the registered qEEG data were exported and analyzed using NeuroGuide Deluxe 3.3.0 (Applied Neuroscience, Inc., USA), with reference to an age-adjusted normative neurodatabase. Z-scores were computed for each region and frequency band to detect deviations from typical neurophysiological patterns.
Assessment of Autonomic Balance
Peripheral autonomic nervous system signals were recorded using the GP8 Amp 8-channel biofeedback amplifier and Alive Pioneer Plus software (Somatic Vision Inc., USA). The parameters assessed included: Heart Rate (HR); Heart Rate Variability (HRV); Peripheral Skin Temperature; Respiratory Rate; Skin Conductance Level (SCL); Surface Electromyography (EMG); HRV indices – such as SDNN (standard deviation of normal-to-normal intervals), total power, LF/HF ratio, stress index, sympathetic nervous system (SNS) index, and parasympathetic nervous system (PNS) index – were first analyzed in Alive Pioneer Plus and then exported for further processing in Kubios HRV Scientific Lite software (University of Eastern Finland).
Neurotherapy Protocol
The patient underwent a 9-month neurotherapy program, with weekly sessions lasting 50 minutes each. The neurotherapy sessions were based on multimodal biofeedback, implemented using the GP8 Amp hardware and Alive Pioneer Plus software (Somatic Vision Inc., USA).
Each session targeted the regulation of multiple physiological parameters, including: Heart rate variability (HRV); Skin conductance level (SCL); Peripheral skin temperature; Respiration.
These signals were used in real-time to provide feedback to the patient, supporting the development of autonomic self-regulation skills.
The therapeutic process followed a custom-designed protocol developed at our Center. This individualized method was based on the patient’s initial functional assessment (qEEG and ANS profile) and adjusted continuously throughout therapy. The protocol emphasized gradual improvement in autonomic flexibility, emotional regulation, and cognitive control.
Session content was tailored to B.’s specific abilities, limitations, and motivational profile. Exercises were designed dynamically and adapted as needed to ensure optimal engagement and therapeutic impact.
Results
Behavioral Observations (Based on Parental Report)
At the beginning of neurotherapy, B.’s screen time ranged from 7–8 hours per day to occasionally up to 10 hours, predominantly spent watching entertainment videos on YouTube. During the second month of therapy, he independently began engaging in physical activity, attending a fitness center twice weekly – his first self-initiated behavioral change since the onset of treatment.
Until the fifth month, there was no consistent reduction in screen use. However, some isolated days were noted where screen time was voluntarily replaced with alternative activities. At the end of the fifth month, after a firm ultimatum from his mother, screen use was limited to 4 hours per day using parental control software – for the first time.
Two weeks after this enforced screen-time restriction, B. became noticeably more energetic, flexible, and physically active. Concurrently, facial tics intensified – particularly discomfort localized to the nasopharyngeal region – and episodes of heightened anxiety re-emerged. These tics had been present since the beginning of therapy, typically occurring in neutral conditions and not associated with speech or specific external stimuli. They tended to worsen under emotional or cognitive stress.
A shift in B.’s interest in communication also became evident. He began initiating conversations with his mother and started listening to classical music again, particularly the works of J.S. Bach. Listening to Bach appeared to calm him. According to his mother, classical music had been a formative part of his early environment. B. possesses absolute pitch, likely inherited from his father, a professional classical musician. As a child, he studied cello (ages 6–9) before transitioning to piano. However, prior to therapy, he had not played an instrument in several years.
In the seventh month of therapy, two months after the first formal screen-time reduction, daily screen exposure was further reduced to 3 hours. In the eight month, screen time decreased again to 2.5 hours. Around this time, B. began copying excerpts from books by hand, which significantly improved his ability to process and retain new information.
According to his mother, B. became markedly more active, playful, and humorous—qualities that had been absent for many years. She described this state as an “emotional awakening.”
By the ninth month of therapy and second formal assessment point, screen time remained at 2.5 hours per day. Facial tics continued to occur but were now limited to episodes of high emotional or cognitive demand.
Physiological Results
Heart Rate Variability (HRV) Parameters
Pre- and post-intervention HRV assessments were performed using Kubios HRV software and are summarized in the figure below (Figure 1). The recordings include a broad range of HRV parameters across time-domain, frequency-domain, and nonlinear domains, as well as calculated stress and autonomic balance indices.
Both datasets are presented using Kubios’ normative comparison tools, indicating deviations across standard deviations from resting-state population norms.
Figure 1 below illustrates the full set of HRV results recorded before (left) and after (right) the neurotherapy intervention.
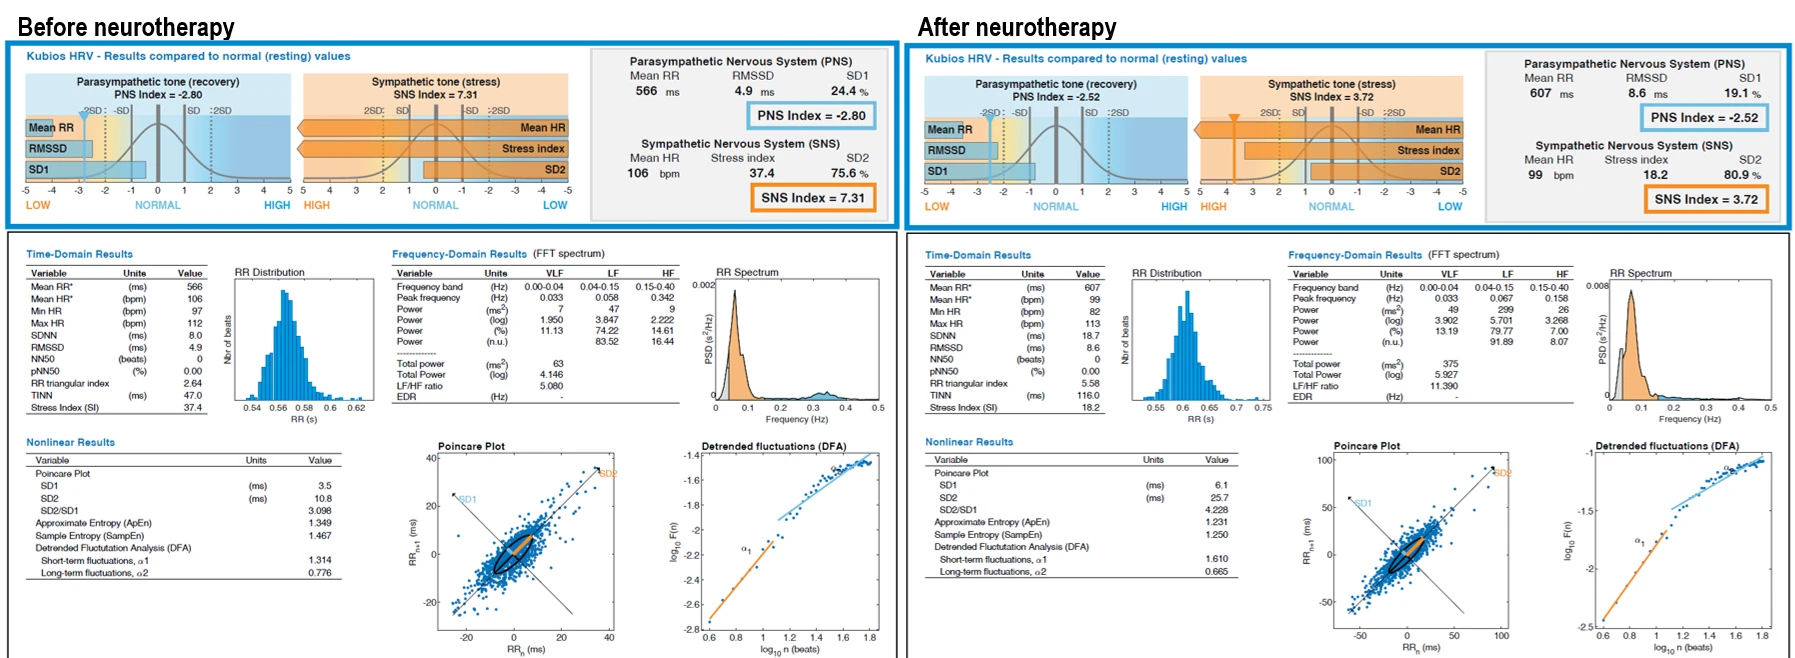
Figure 1. Pre- and post-intervention heart rate variability (HRV) parameters. The left panel displays baseline values prior to the start of neurotherapy; the right panel shows HRV results after completion of the intervention. Parameters include time-domain, frequency-domain, and nonlinear metrics, as well as stress and autonomic balance indices. Mean RR (ms): average interval between successive heartbeats; Mean HR (bpm): average heart rate; Min HR / Max HR (bpm): minimum and maximum heart rate during recording; SDNN (ms): standard deviation of NN intervals (overall HRV); RMSSD (ms): root mean square of successive RR interval differences (parasympathetic marker); NN50 (beats): number of successive RR intervals differing by more than 50 ms; pNN50 (%): percentage of NN50 in total beats; TINN (ms): triangular interpolation of RR histogram; RR Triangular Index: ratio of total RR intervals to histogram peak; Stress Index (SI): indicator of sympathetic arousal; VLF / LF / HF (ms² or log): spectral power in very low, low, and high frequency bands; LF/HF Ratio: index of autonomic balance; Total Power (ms²): overall spectral power; EDR (Hz): estimated respiratory rate derived from RR intervals; SD1 (ms): short-term HRV from Poincaré plot (parasympathetic tone); SD2 (ms): long-term HRV from Poincaré plot (global tone); SD2/SD1 Ratio: indicator of sympathetic dominance; Sample Entropy / Approximate Entropy: complexity and irregularity of HR signal; DFA α1 / α2: short- and long-term scaling exponents from detrended fluctuation analysis; PNS Index: normalized parasympathetic activity score; SNS Index: normalized sympathetic activity score.
Comparison of pre- and post-intervention heart rate variability (HRV) parameters revealed notable shifts across all major domains. In the autonomic indices, the PNS index improved slightly from –2.80 to –2.52, while the SNS index showed a substantial decrease from 7.31 to 3.72, indicating a marked reduction in sympathetic dominance. The stress index was reduced by more than 50%, dropping from 37.4 to 18.2.
Time-domain parameters reflected a general increase in HRV. The mean RR interval increased from 566 ms to 607 ms, corresponding to a reduction in average heart rate from 106 to 99 bpm. Minimum heart rate dropped from 100 to 89 bpm, while the maximum remained relatively stable. SDNN increased from 11.2 ms to 18.7 ms, suggesting improved global variability. RMSSD rose from 4.9 ms to 8.6 ms, indicating enhanced parasympathetic modulation. Although NN50 remained unchanged at zero, other structural measures such as TINN and the RR triangular index showed significant gains, increasing from 47.0 ms to 116.0 ms and from 2.64 to 5.58 respectively.
In the frequency domain, a strong upward trend was observed. VLF power increased from 1.950 to 13.19 ms², LF power from 3.847 to 79.77 ms², and HF power from 2.222 to 9.887 ms². Total power rose nearly sixfold, from 63 to 375 ms². The LF/HF ratio increased substantially from 1.730 to 11.390, reflecting a shift in autonomic balance that will be interpreted further in the discussion. Estimated respiratory rate (EDR) also increased from 0.20 Hz to 0.32 Hz.
Nonlinear measures supported the overall pattern of improved autonomic function. SD1 and SD2 increased from 3.5 ms to 6.1 ms and from 10.9 ms to 25.7 ms, respectively, while the SD2/SD1 ratio rose from 3.098 to 4.228. Slight decreases were observed in entropy measures, with approximate entropy dropping from 1.467 to 1.231 and sample entropy from 1.487 to 1.250. Detrended fluctuation analysis revealed an increase in short-term fractal scaling (DFA α1) from 1.314 to 1.610, while long-term scaling (DFA α2) decreased slightly from 0.776 to 0.665.
These physiological changes were consistent with the clinical impression of improved autonomic flexibility and behavioral responsiveness observed in the later stages of therapy.
Electroencephalographic Results
Quantitative electroencephalography (qEEG) was performed using a 19-channel monopolar montage to assess absolute power distributions and Z-score deviations across standard frequency bands. Recordings were conducted under eyes-closed and eyes open resting-state conditions.
Before the intervention, the absolute power spectra demonstrated elevated activity in the delta and theta bands, especially across frontal and central channels. Theta band peaks were consistently high across multiple sites. The Z-score analysis revealed widespread deviations from normative values, particularly in the slower frequencies (delta, theta), with multiple channels exceeding +2 standard deviations from the normative mean.
After the intervention, the qEEG results showed reduced absolute power in the delta and theta bands. There was a visible reorganization of the spectral distribution, with greater balance across the midline and posterior derivations. Z-score plots showed fewer excursions outside the normative range, particularly in the low-frequency bands. Alpha band activity increased in parieto-occipital regions, and overall power appeared more evenly distributed across hemispheres.
Raw traces from both sessions confirm these spectral changes, as visualized by relative amplitude consistency, baseline flattening in low-frequency activity, and stabilization in midline cortical rhythms.
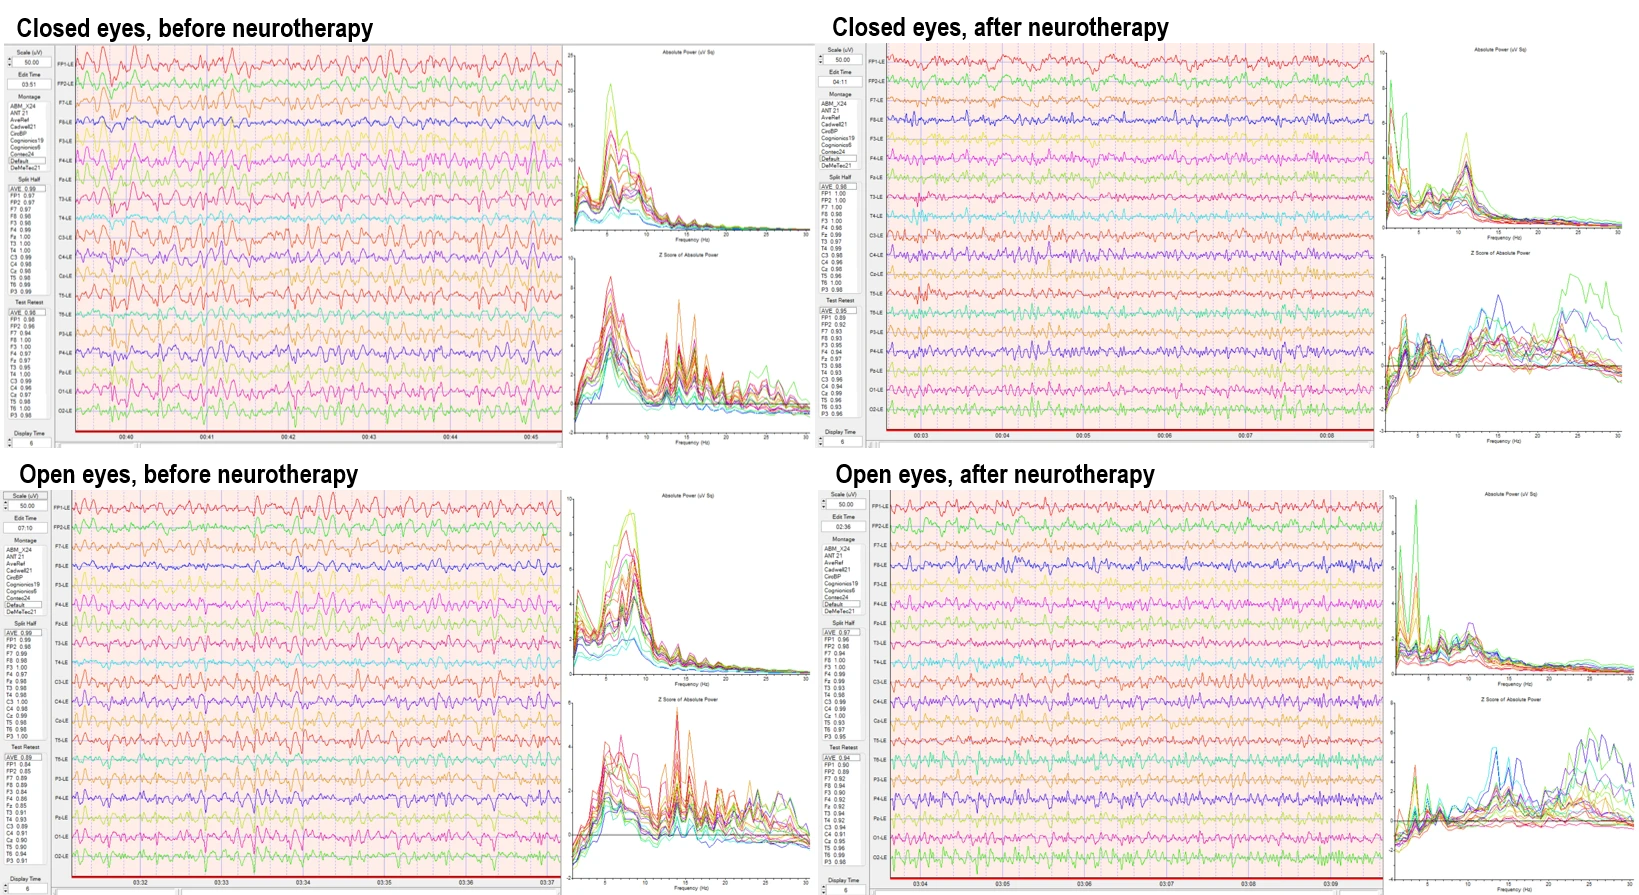
Figure 2. Quantitative EEG results before (left) and after (right) the intervention. Upper panels show raw EEG traces and spectral analyses under eyes-closed resting condition; lower panels show eyes-open condition. Spectral outputs include absolute power and Z-score profiles across delta, theta, alpha, beta, and high beta bands using 19-channel monopolar montage.
Z-score topographical brain maps were generated to illustrate deviations from normative EEG activity across standard frequency bands, providing insight into cortical over- or underactivation patterns.
Figure 3-1 and figure 3-2 present the Z-score deviations for the eyes-closed condition, comparing pre- and post-intervention recordings. The left panels illustrate pre-intervention data, showing prominent positive deviations (Z > +2) in the delta (1–4 Hz) and theta (4–8 Hz) bands, especially over frontal and central areas. Alpha activity is overexpressed over left frontal areas, and elevated beta (12–25 Hz) and high beta (25–30 Hz) power is observed in frontotemporal regions, indicating a potential state of hyperarousal and dysregulation. Post-intervention maps (right panels) demonstrate a substantial normalization, with reduced Z-score deviations in both low and high frequency bands. Alpha band activity becomes more evenly distributed, and frontal beta hyperactivity is significantly attenuated.
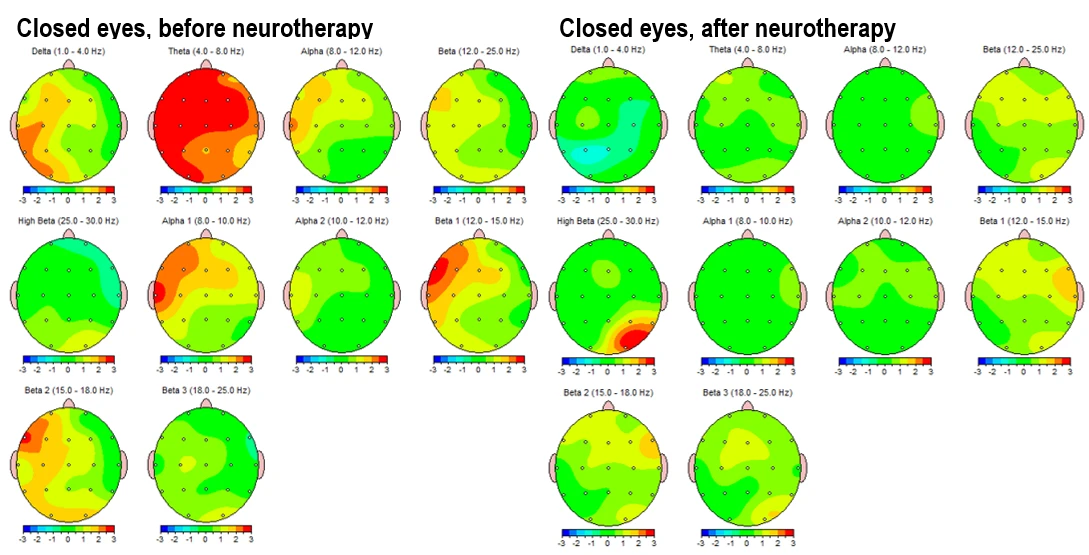
Figure 3-1. Topographical Z-score maps FFT absolute power for the eyes-closed condition before (left) and after (right) neurotherapy. Frequencies include delta (1–4 Hz), theta (4–8 Hz), alpha 1 (8–10 Hz), alpha 2 (10–12 Hz), beta 1 (12–15 Hz), beta 2 (15–19 Hz) and beta 3 (18–25 Hz).
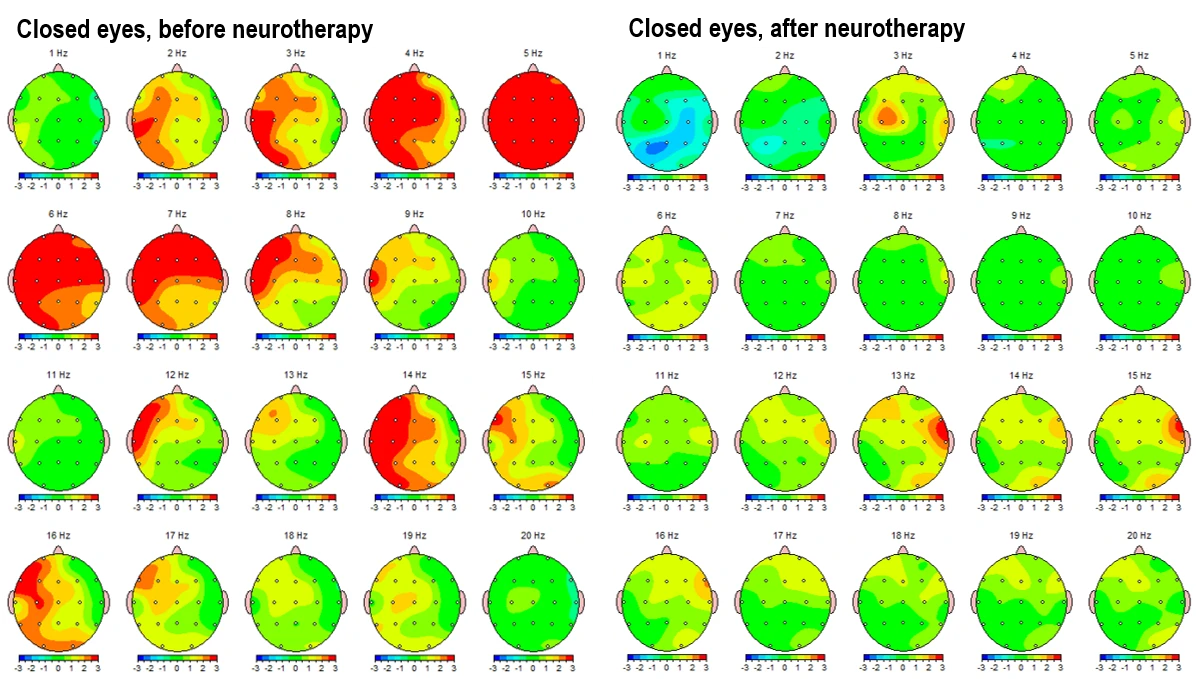
Figure 3.2. Z-score frequency-specific brain maps (1–20 Hz) FFT absolute power during eyes-closed resting state, comparing pre-intervention (left) and post-intervention (right) data.
Figure 3-3 shows topographic maps of the main spectral power ratios in the eyes-closed condition: pre-intervention on the left and post-intervention on the right.
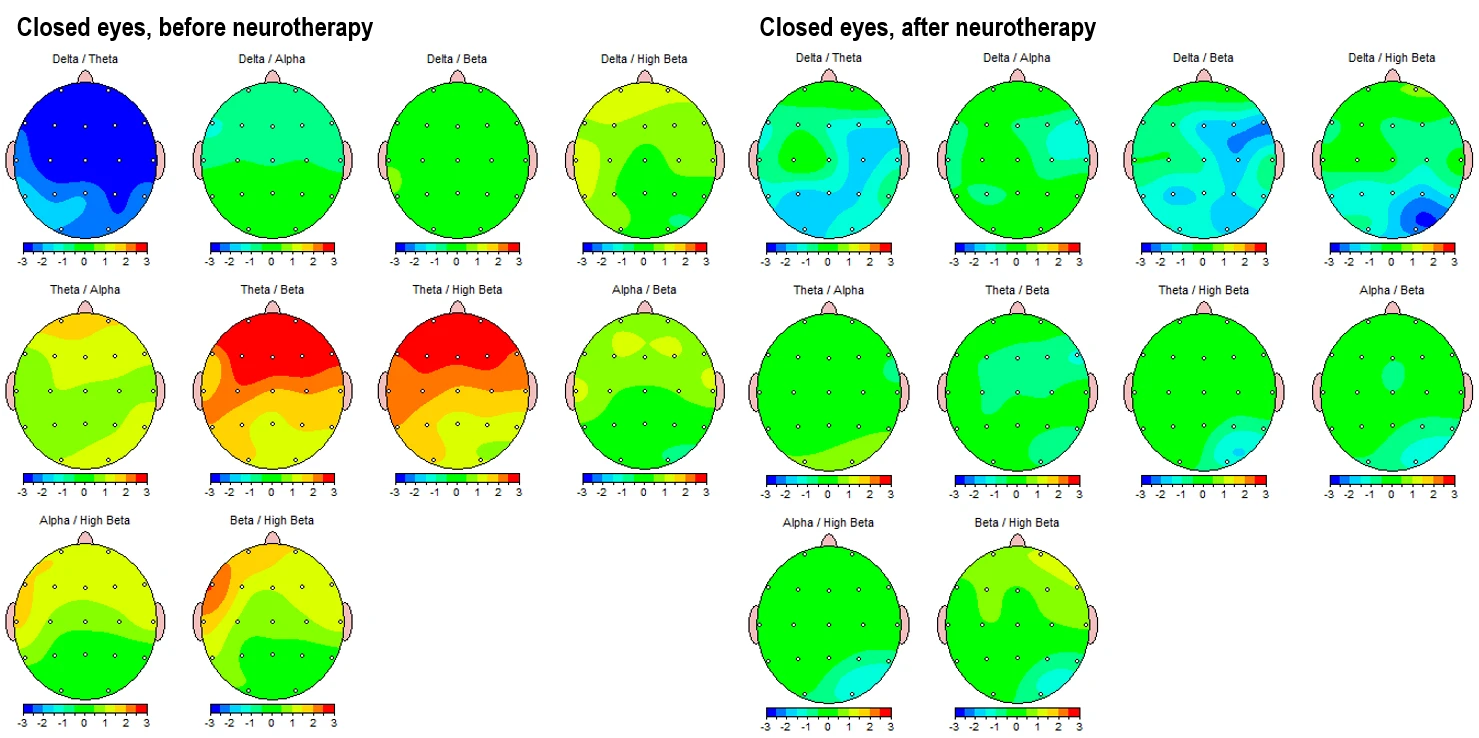
Figure 3-3. Topographic Maps of EEG Power Ratios (Eyes-Closed Condition). Left panels: Pre-intervention; Right panels: Post-intervention.
The theta/beta and theta/high beta ratios, which are commonly used markers of attentional and executive function regulation, show a reduction in anterior hyperactivation (initially in red and orange) and a movement toward more neutral or slightly subnormal values (green). This is most evident frontally in the eyes-closed state and centro-parietally in the eyes-open state. (Fig. 4-3)
Similarly, the alpha/beta and alpha/high beta ratios reflect an improvement in cortical activation balance.
In summary, the ratio maps demonstrate a consistent reorganization of cortical dynamics, particularly in slowing/fasting balance and frontal-parietal integration, which suggests a neurophysiological shift toward a more regulated brain state following neurotherapy.
Figure 4-1 and 4-2 displays the corresponding eyes-open condition, showing a similar trend. Pre-intervention maps (left panels) reveal elevated theta and alpha activity in left frontotemporal and posterior regions, alongside dysregulated beta expression, particularly in the beta 1 and beta 2 sub-bands in left hemisphere (LHS). Post-intervention maps (right panels) indicate global improvements, including attenuation of slow-wave overactivation and better-regulated beta activity, especially in frontal regions.
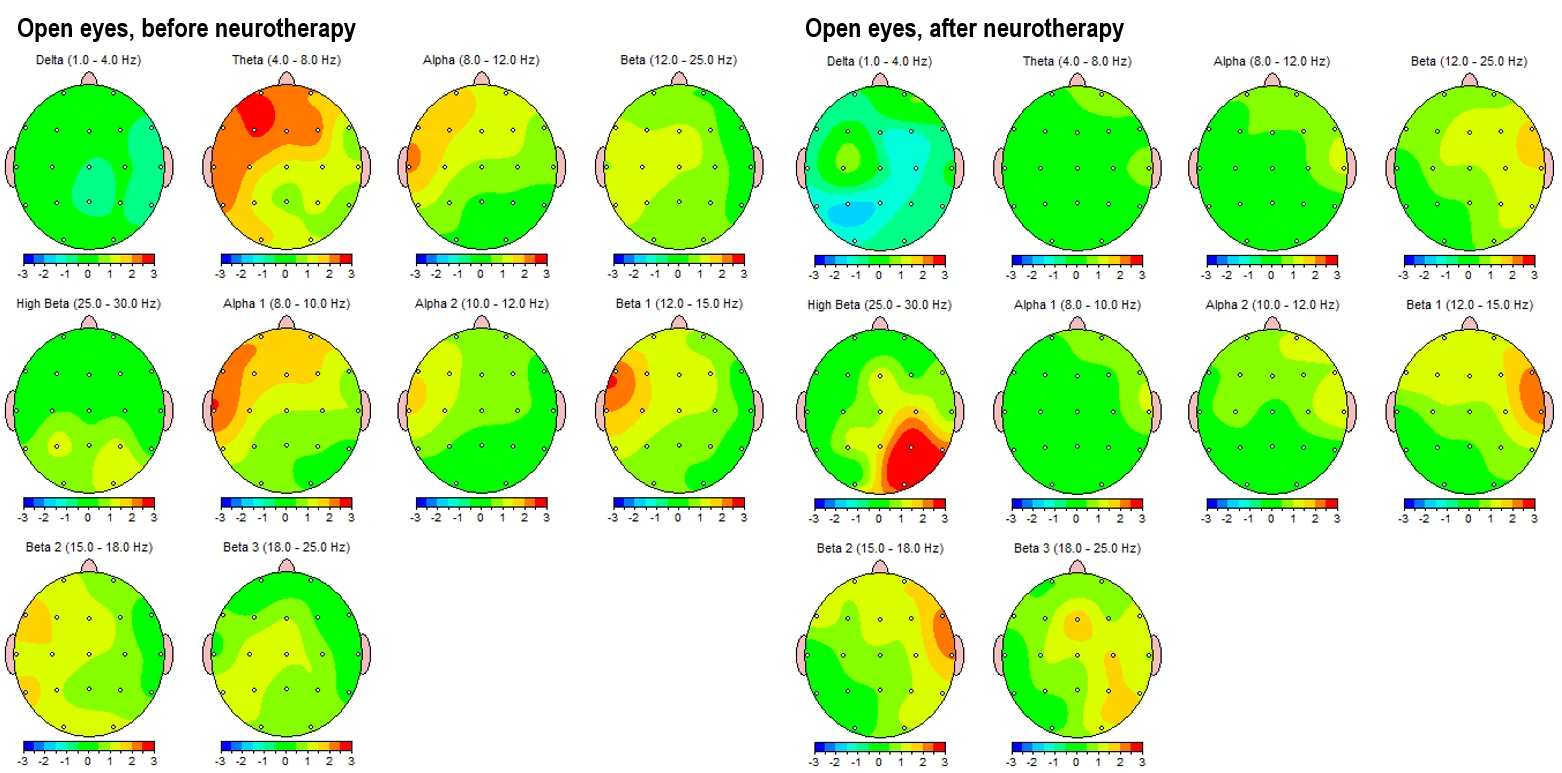
Figure 4-1. Topographical Z-score maps FFT absolute power for the eyes-open condition before (left) and after (right) intervention
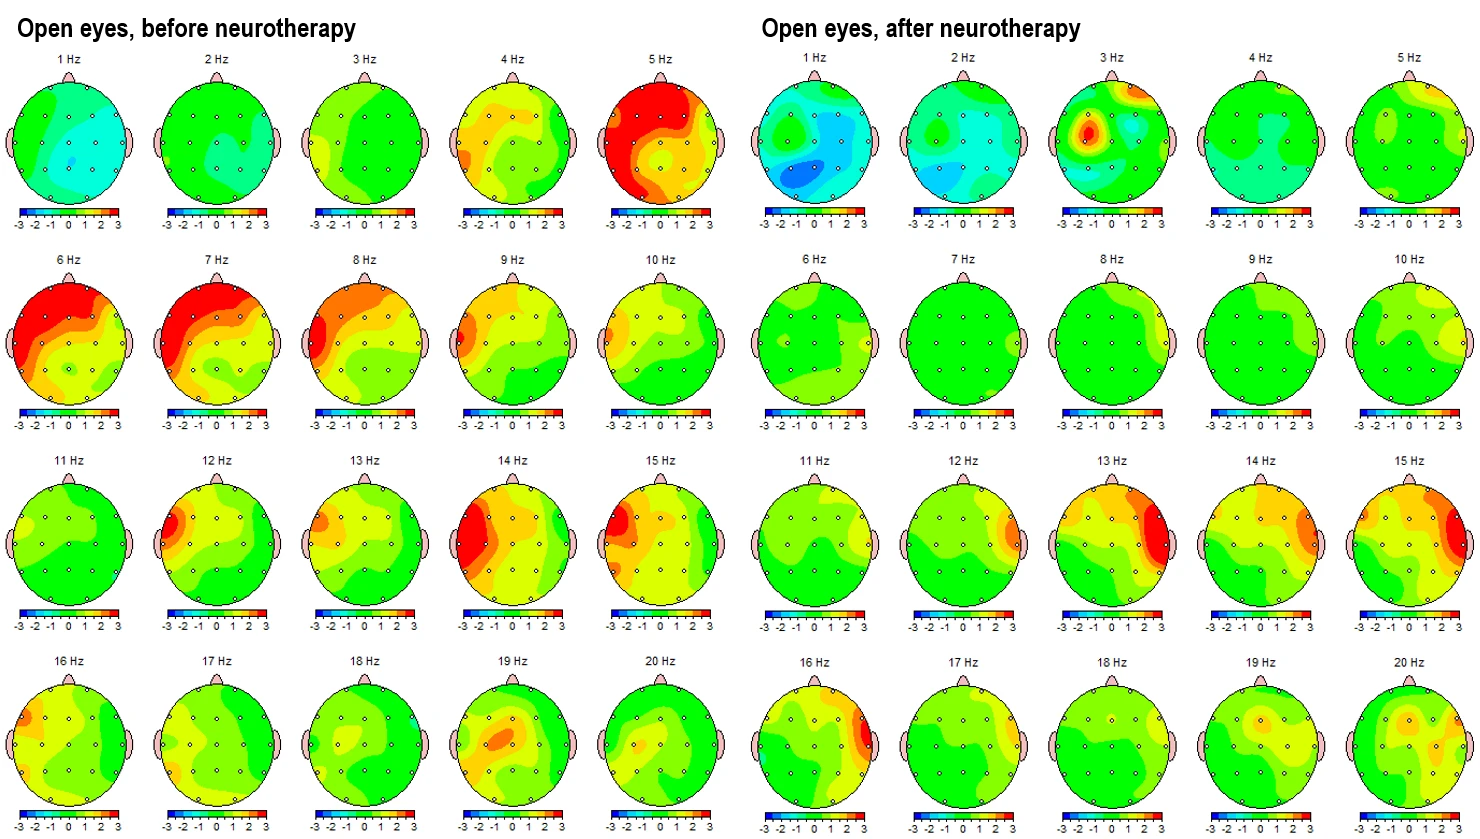
Figure 4.2. Z-score frequency-specific maps (1–20 Hz) FFT absolute power during eyes-open condition, pre- (left) and post- (right) intervention.
These topographical patterns are corroborated by frequency-specific maps (Figures 3-2 and 4-2), showing Z-score distributions from 1 Hz to 20 Hz. In the pre-intervention data, widespread red zones (Z > +2) are evident across lower frequencies (1–9 Hz), with peaks around 4–6 Hz across frontotemporal leads. Post-intervention maps reveal these regions shifting into the normative range (Z between –1 and +1), with better symmetry and reduced cortical dysrhythmia.
Figure 4-3 shows the corresponding power ratios in the eyes-open condition.
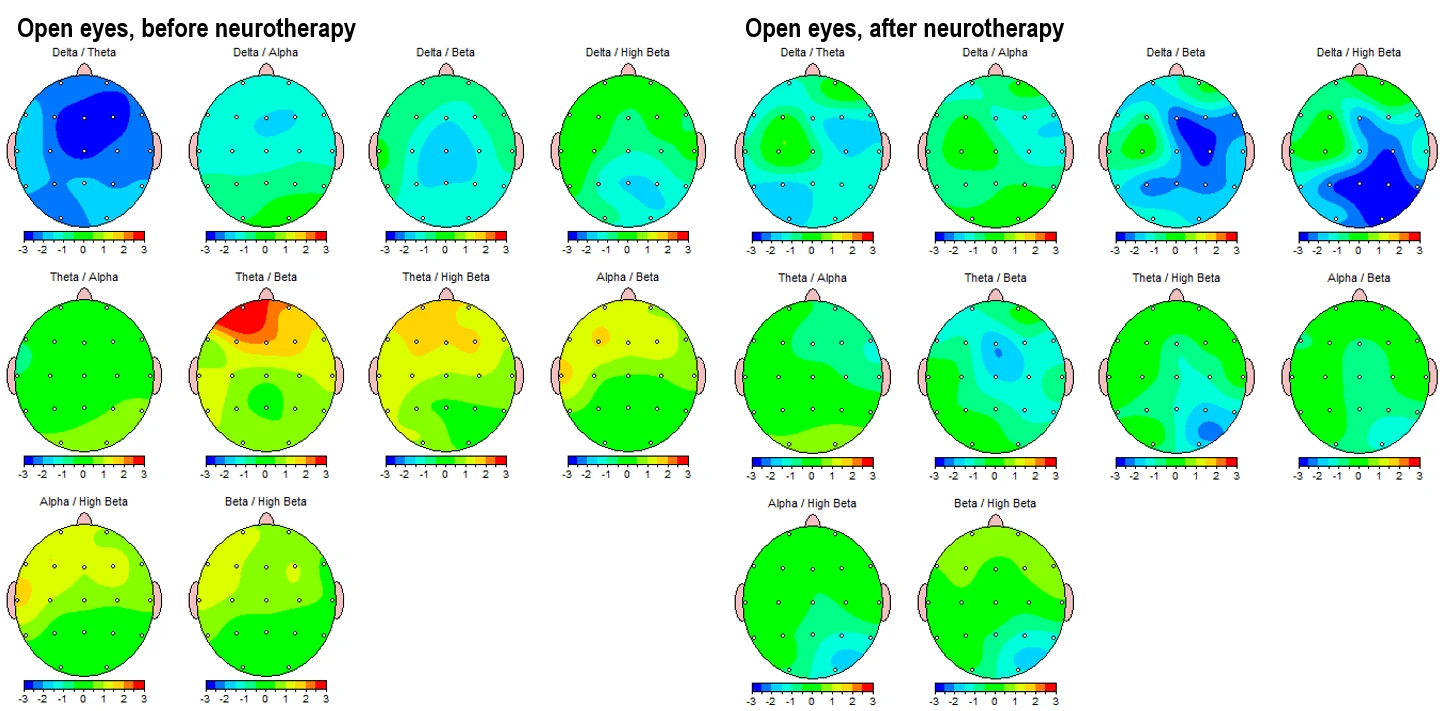
Figure 4-3. Topographic Maps of EEG Power Ratios (Eyes-open Condition). Left panels: Pre-intervention; Right panels: Post-intervention.
In the pre-intervention state (Fig. 5-1, upper left panels), asymmetry values in the theta band show multiple interhemispheric deviations, with frontal and parietal asymmetries being most prominent. Alpha asymmetry is present along frontal and temporal lines, while beta asymmetry shows minor deviation with one affected electrode pair (F7-F8).
In the post-intervention condition (right panels), theta and alpha asymmetries are completely reduced, with beta asymmetry persisting in a single posterior region.
For coherence, pre-intervention maps (Fig. 5-1, down left panels) indicate increased connectivity across both hemispheres, with strong coherence values predominantly in the beta band and multiple lines spanning interhemispheric and intrahemispheric zones.
After the intervention, coherence patterns appear more spatially limited, with fewer connections present across all frequency bands.
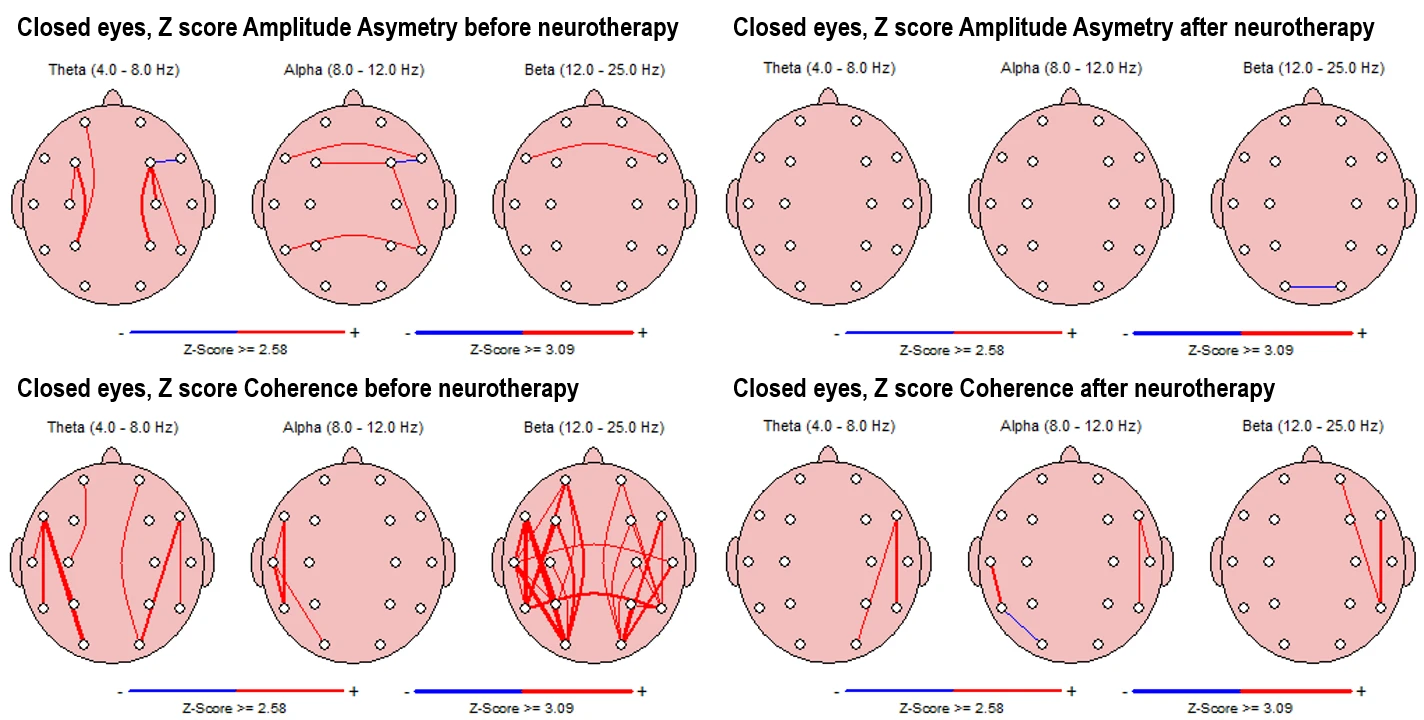
Figure 5-1. Z-score Asymmetry (Top) and Coherence (Bottom) in Eyes-Closed Condition. Left panels: Pre-intervention; Right panels: Post-intervention
Alpha asymmetry (Fig. 5-2, upper left panels) in the pre-intervention state shows scattered interhemispheric deviations, especially between temporal, frontal and central regions, while beta asymmetry is completely reduced compared to the eyes-closed condition.
Post-intervention maps reveal a marked reduction in asymmetry across all frequency bands, with only isolated deviations remaining.
Coherence values (Fig. 5-2, down left panels) in the pre-intervention state are elevated in alpha and theta bands in left temporal-occipital regions, especially strong in beta, which shows extensive interhemispheric and long-range coherence lines.
In the post-intervention condition, coherence is reduced across theta, alpha, and beta bands (completely in LHS and interhemispheric), with connectivity becoming more spatially restricted and less pronounced.
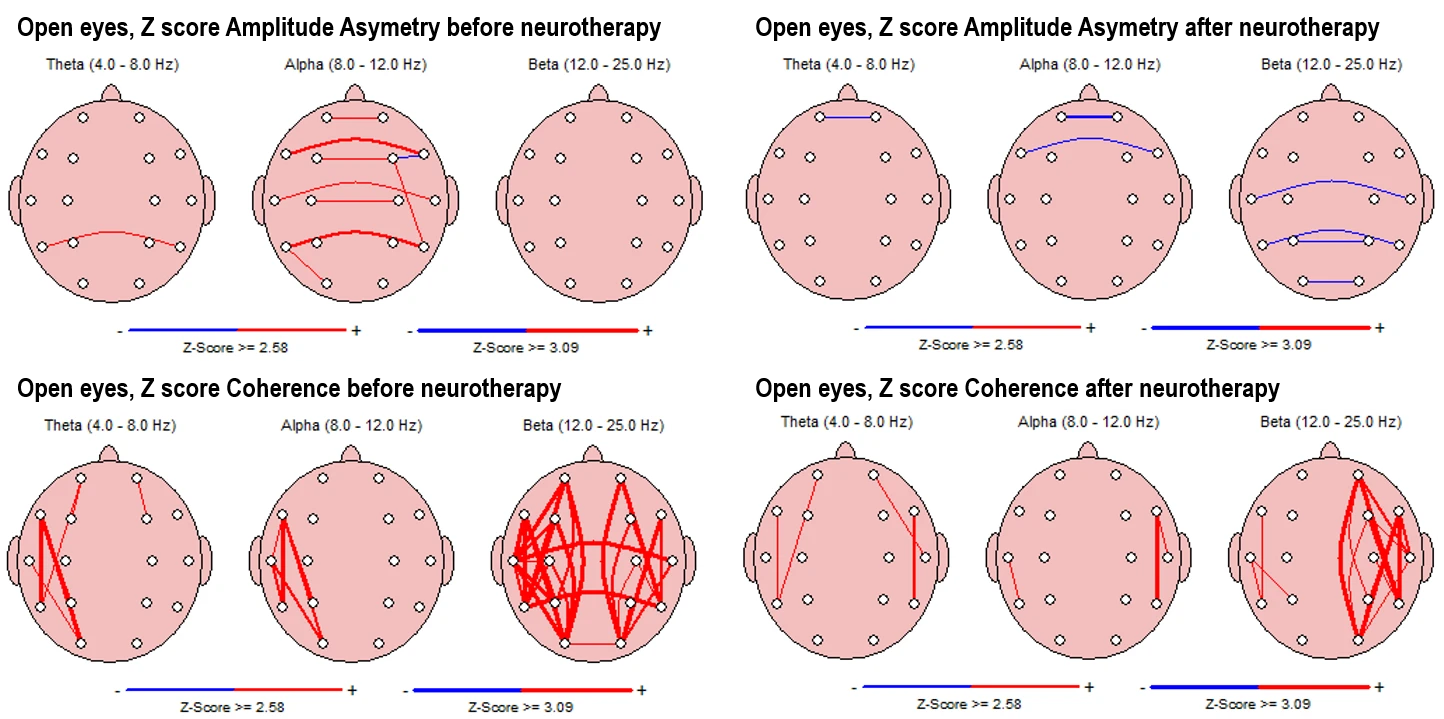
Figure 5-2. Z-score Asymmetry (Top) and Coherence (Bottom) in Eyes-Open Condition. Left panels: Pre-intervention; Right panels: Post-intervention
Discussion
HRV Changes
Our modal findings show that post‑intervention, almost all HRV metrics improved—SDNN and RMSSD increased substantially, total power rose nearly sixfold, the stress index halved, and SNS index dropped while PNS index improved modestly. These patterns align closely with effects reported in HRV biofeedback interventions for clinical populations. For example, a meta‑analytic review including 484 participants reported significant reductions in self‑reported stress and anxiety, alongside increased HRV measures after HRVB training. (Schuman et al., 2021) Similarly, a pilot study in adolescents at risk of internet/addiction use demonstrated enhanced total power and reduced sympathetic tone following HRVB. (Poskotinova et al., 2020) In severe mental health conditions such as schizophrenia or PTSD, literature consistently points to baseline HRV being significantly lower than in healthy controls. (Wang et al., 2025)
Our patient’s high SNS index and elevated LF/HF ratio at baseline are consistent with this pattern of autonomic imbalance. Post‑therapy increases in RMSSD, HF power, SD1 and total power suggest a reactivation of parasympathetic regulation, a neurophysiological recovery that is frequently associated with improved emotional resilience and cognitive control. Notably, our dramatic rise in LF power and LF/HF ratio—while potentially interpreted as sympathetic dominance—must be understood within broader HRV biofeedback literature. LF band reflects both sympathetic and parasympathetic influences, and increased LF power can indicate enhanced baroreflex sensitivity and improved autonomic flexibility in the context of HRVB training. In fact, many studies of slow‑paced breathing biofeedback report simultaneous gains in LF, HF, total power and reduced stress index. (Blaser et al., 2023)
Nonlinear measures such as SD1 and SD2 also more than doubled, reflecting increased heart rate complexity. Slight reductions in entropy measures (ApEn and SampEn) are within expected ranges, suggesting more structured variation consistent with improved physiological coherence after intervention. Changes in DFA parameters—with increased α1—align with stabilization of short‑term autonomic dynamics often seen after self‑regulatory training. (Tatschl et al., 2020)
These HRV shifts are concordant with key theoretical models such as neurovisceral integration, which posit that enhanced parasympathetic control underpins better emotion regulation, attention, and executive functioning. In essence, our case mirrors – and extends into early adulthood – results previously observed in adolescents and adults undergoing HRVB, indicating that even chronic screen-related dysregulation coupled with trauma history can be mitigated through neurofeedback‑guided interventions.
qEEG Changes
The electroencephalographic findings observed across eyes-closed and eyes-open resting states reflect substantial neurophysiological changes following the course of neurotherapy. The reduction in absolute power in the theta and alpha bands after the intervention is particularly noteworthy. Elevated power in these slow-wave bands is commonly associated with cortical underarousal, frontal executive dysfunction, and affective dysregulation, particularly when localized in anterior and central regions. The normalization of these frequencies aligns with prior research demonstrating improved regulatory control and arousal stability following neurofeedback and biofeedback-based interventions (Thompson & Thompson, 2003).
Z-score normalization across both low and high frequencies corroborates these patterns. The significant reduction in deviations beyond ±2 standard deviations from normative means signals a movement toward neurotypical electrophysiological functioning.
Power ratio maps provide additional insight into the reorganizational dynamics. The reduction in theta/beta and theta/high beta ratios, particularly frontally in LHS, is frequently interpreted in clinical EEG literature as a marker of improved attentional control and executive stability. Elevated ratios in these domains have long been associated with ADHD and emotional dysregulation (Monastra et al., 2001), and the current findings suggest a reversal of this trend post-intervention. Similarly, improvements in alpha/beta and alpha/high beta ratios point to a more balanced excitatory–inhibitory tone across cortical regions.
The eyes-open condition further supports these findings, showing a reduction in slow-wave overactivity and better regulation of beta frequencies, especially in the left hemisphere. These changes are consistent with models of improved sensory integration and cognitive activation, particularly in frontal–temporal and parietal leads, which are critical for attentional orientation and working memory processes (McEvoy et al., 2000; Barry et al., 2003).
Asymmetry and coherence measures further support the interpretation of functional reorganization. In the pre-intervention state, the presence of elevated interhemispheric asymmetries, especially in the theta and alpha bands, is suggestive of lateralized dysfunction and impaired inter-regional integration. The subsequent reduction of asymmetry post-intervention implies improved interhemispheric communication and hemispheric balance. Similarly, the reduction in coherence values across beta and theta bands may represent a move from hyperconnected or dysregulated cortical networks toward a more differentiated and flexible neurodynamic state. Excessive beta coherence has been associated with over-engagement of cognitive control networks, often observed in high-anxiety or compulsive phenotypes (Hammond, 2005). The post-intervention pattern, with more spatially specific and less diffuse coherence lines, suggests improved functional segregation and network specialization.
Taken together, these qEEG findings suggest that neurotherapy in this case was associated with a significant shift in brain function, including decreased cortical underactivation, better spectral balance, reduced deviation from normative EEG patterns, and improved intra- and interhemispheric communication. The observed changes align well with those reported in neurotherapy literature for individuals with attentional dysregulation, emotional instability and screen addiction.
Minor and partial improvements in autonomic regulation were observed during the first phase of therapy; however, substantial and sustained neurophysiological and behavioral changes only emerged after a marked reduction in screen exposure was implemented following the decisive involvement of the mother. This shift underscores the critical role of environmental restructuring—particularly limiting screen time—in enhancing the efficacy of neurotherapeutic interventions, especially in cases involving screen-related dissociation and attentional fragmentation. As our previous studies have shown, without addressing the underlying screen addiction, the therapeutic gains of both pharmacological and non-pharmacological treatments remain limited (Ivanova et al., 2025; Vezenkov & Manolova, 2025a; 2025d).
Conclusion
This case study illustrates the complex interplay between early relational trauma, screen addiction, screen trauma, and misdiagnosis within the schizophrenia spectrum. Despite years of pharmacological treatment with antipsychotics and multiple psychiatric consultations, no substantial improvement was observed until targeted neurotherapy was combined with strict reduction of screen exposure and addressing the screen addiction. Quantitative EEG and HRV assessments confirmed significant neurophysiological reorganization following the intervention, including normalization of spectral power, reduced asymmetry and coherence deviations, and improved autonomic balance. These changes were paralleled by meaningful behavioral improvements such as emotional re-engagement, increased motivation, and restored cognitive flexibility.
Our findings underscore that biofeedback interventions can be effective in cases previously deemed treatment-resistant, but only when accompanied by ecological restructuring – particularly addressing the screen addiction/trauma. The case emphasizes the necessity of trauma-informed, context-sensitive diagnostics and integrative approaches, highlighting that persistent screen addiction may mimic or mask deeper neuroaffective dysregulations. Future research should continue to explore the boundaries between screen-induced functional states and primary psychiatric disorders to improve therapeutic outcomes.
References
Barry, R. J., Clarke, A. R., McCarthy, R., & Selikowitz, M. (2002). EEG coherence in attention-deficit/hyperactivity disorder: a comparative study of two DSM-IV types. Clinical Neurophysiology, 113(4), 579-585. https://doi.org/10.1016/S1388-2457(02)00036-6
Blaser, B. L., Weymar, M., & Wendt, J. (2023). The effect of a single-session heart rate variability biofeedback on attentional control: does stress matter? Frontiers in Psychology, 14, 1292983. https://doi.org/10.3389/fpsyg.2023.1292983
Hammond, D. C. (2005). Neurofeedback treatment of depression and anxiety. Journal of Adult Development, 12(2–3), 131–137. https://doi.org/10.1007/s10804-005-7029-5
Ivanova V.D., Mitsova S.A., Petrova T.G., Manolova V.R. and Vezenkov S.R. (2025) Full Recovery of a 10-Year-Old Girl with Persistent Screen Addiction Since Age 2 and Autism Spectrum Disorder: Case Report. Nootism 1(3), 17-26. https://doi.org/10.64441/nootism.1.3.3
Manolova V.R. and Vezenkov S.R. (2025a) Screen Trauma – Specifics of the Disorder and Therapy in Adults and Children. Nootism 1(1), 37-51. https://doi.org/10.64441/nootism.2NCSC.3
Manolova V.R. and Vezenkov S.R. (2025b) Are Screen-Induced Synesthesia and Screen-induced Cue-Dependent Behavior Contributing Factors in the Misdiagnosis of ASD Among Children with Screen Addiction? Nootism 1(3), 11-16. https://doi.org/10.64441/nootism.1.3.2
Manolova, V.R., Pashina, I.H., Mateev M.I and Vezenkov, S.R. (2025) Munchausen Syndrome by Proxy and Other Forms of Parental Abuse in Children with Screen Addiction and a Diagnosis of Autism (ASD) and/or ADHD. Nootism 1(2), 11-30. https://doi.org/10.64441/nootism.1.2.2
Mateev M.I., Pashina I.H., Manolova V.R. and Vezenkov S.R. (2025) Restoring Neural Coherence Through Screen Addiction Therapy in a 12-Year-Old with Autism Spectrum Disorder: Case Report. Nootism 1(3), 27-33. https://doi.org/10.64441/nootism.1.3.4
McEvoy, L. K., Smith, M. E., & Gevins, A. (2000). Test–retest reliability of cognitive EEG. Clinical Neurophysiology, 111(3), 457–463. https://doi.org/10.1016/S1388-2457(99)00258-8
Monastra, V. J., Lubar, J. F., & Linden, M. (2001). The development of a quantitative electroencephalographic scanning process for attention deficit–hyperactivity disorder: Reliability and validity studies. Neuropsychology, 15(1), 136–144. https://doi.org/10.1037/0894-4105.15.1.136
Petrov P.P., Manolova V.R. and Vezenkov S.R. (2025) Hidden Family Dynamics in a Case Study of a Child with Screen Addiction, Hyperactivity, and Language Deficits. Nootism 1(1), 90-95. https://doi.org/10.64441/nootism.2NCSC.10
Poskotinova, L., Krivonogova, O. V., & Zaborsky, O. S. (2020). Effectiveness of short-term heart rate variability biofeedback training and the risk of internet addiction in adolescents 15-16 years of age. International Journal of Biomedicine, 10(2), 153-156. http://dx.doi.org/10.21103/Article10(2)_OA13
Schumann, A., de la Cruz, F., Köhler, S., Brotte, L., & Bär, K. J. (2021). The Influence of Heart Rate Variability Biofeedback on Cardiac Regulation and Functional Brain Connectivity. Frontiers in neuroscience, 15, 691988. https://doi.org/10.3389/fnins.2021.691988
Tatschl, J. M., Hochfellner, S. M., & Schwerdtfeger, A. R. (2020). Implementing mobile HRV biofeedback as adjunctive therapy during inpatient psychiatric rehabilitation facilitates recovery of depressive symptoms and enhances autonomic functioning short-term: A 1-year pre–post-intervention follow-up pilot study. Frontiers in Neuroscience, 14, 738. https://doi.org/10.3389/fnins.2020.00738
Thompson, L., & Thompson, M. (2003). The neurofeedback book: An introduction to basic concepts in applied psychophysiology. Association for Applied Psychophysiology and Biofeedback.
Vezenkov, S. R., and Manolova, V. R. (2024). A Central Role of Biofeedback in a Complex Therapy of Screen Devices Usage Addiction. BFE 21tst Meeting Montesilvano, Italy, 21-22 September 2022, In APPLIED PSYCHOPHYSIOLOGY AND BIOFEEDBACK. Vol. 49, No. 1, 173-173. https://doi.org/10.1007/s10484-023-09607-0
Vezenkov, S.R. and Manolova V.R. (2025d) Neurobiology of Autism/Early Screen Addiction Recovery. Nootism 1(1), 19-36. https://doi.org/10.64441/nootism.2NCSC.2
Vezenkov, S.R. and Manolova, V.R. (2025a) Screen Addiction – Biomarkers, Developmental Damage and Recovery. Nootism 1(1), 6-18. https://doi.org/10.64441/nootism.2NCSC.1
Vezenkov, S.R. and Manolova, V.R. (2025b) Screen-Induced Pathological Eye-Covering Reflex in Children with Early Screen Addiction. Nootism 1(3), 5-10. https://doi.org/10.64441/nootism.1.3.1
Vezenkov, S.R. and Manolova, V.R. (2025c) Screen-Induced Pathological Vestibular Reflex: A Specific Marker of Early Screen Addiction. Nootism 1(2), 5-10. https://doi.org/10.64441/nootism.1.2.1
Wang, Z., Zou, Y., Liu, J., Peng, W., Li, M., & Zou, Z. (2025). Heart rate variability in mental disorders: an umbrella review of meta-analyses. Translational Psychiatry, 15(1), 104. https://doi.org/10.1038/s41398-025-03339-x