

Violeta R. Manolova and Stoyan R. Vezenkov
Center for applied neuroscience Vezenkov, BG-1582 Sofia, e-mail: info@vezenkov.info
For citation: Manolova V.R. and Vezenkov S.R. (2025) Cortico-Autonomic Dysregulation in Generalized Anxiety Disorder and Irritable Bowel Syndrome: A Combined EEG–HRV Case Study. Nootism 1(5), 21-34, https://doi.org/10.64441/nootism.1.5.2
Abstract
This case study presents an in-depth exploration of two women with comorbid generalized anxiety disorder (GAD) and severe irritable bowel syndrome (IBS), highlighting the intersection of psychophysiological stress and autonomic regulation through quantitative electroencephalography (qEEG) and heart rate variability (HRV). The patients, aged 60 and 50 years, both exhibited significant somatic symptoms (e.g., chronic constipation, abdominal pain, and emotional distress) closely intertwined with complex psychosocial and psychosexual dynamics. The therapeutic process aimed at addressing autonomic imbalances and stress regulation revealed striking patterns of neurophysiological hyperarousal in both cases.
At baseline, qEEG findings revealed excess beta activity, primarily in the 25-30 Hz range, indicating a state of cortical hypervigilance. Both patients also exhibited low parasympathetic activity (as indicated by RMSSD and HF power) and elevated sympathetic dominance (shown by LF/HF ratios and SNS index), confirming the presence of cortico-autonomic dysregulation. While both patients made progress in symptom management, therapy was prematurely discontinued after 13-14 sessions due to persistent cognitive-emotional rigidity and psychosocial barriers. These findings underline the role of interoceptive awareness, emotional regulation, and autonomic flexibility in therapeutic engagement and recovery.
The clinical implications are twofold: (1) the EEG–HRV profile provides a stable, objective measure of cortico-autonomic hyperarousal that can serve as a biomarker of therapeutic progress and engagement; and (2) psychosocial dynamics, including rigid behavioral patterns and longstanding emotional conflicts, must be concurrently addressed for effective treatment. The study suggests the need for longitudinal research to examine how autonomic regulation and cortical rhythms evolve with multimodal interventions, such as HRV biofeedback.
Keywords: Generalized anxiety disorder (GAD); Irritable bowel syndrome (IBS); Cortico-autonomic dysregulation; qEEG, Heart rate variability (HRV); Sympathetic dominance; Parasympathetic withdrawal; Biofeedback; Anxiety and gut-brain axis; Treatment engagement
Introduction
Irritable bowel syndrome (IBS) is the most prevalent disorder of gut–brain interaction, affecting roughly 5–10% of the global population and frequently co‑occurring with psychiatric symptoms, especially anxiety and depression. Large reviews estimate that people with IBS have markedly higher rates of anxiety/depressive symptoms than healthy controls and that this psychological comorbidity substantially worsens quality of life and health‑care utilization. These observations support a bidirectional “brain–gut” framework in which central and peripheral processes interact to shape symptom burden. (Mayer et al., 2023; Staudacher et al., 2023)
Across anxiety disorders, including generalized anxiety disorder (GAD), autonomic alterations are well documented. Meta‑analytic evidence shows that resting heart‑rate variability (HRV) - a noninvasive index of cardiac autonomic regulation - is reduced in anxiety, reflecting lower vagally mediated modulation of the sinoatrial node. Conceptually, these autonomic patterns are consistent with the neurovisceral‑integration model, which links prefrontal–limbic regulatory circuits with vagal output and adaptive emotion regulation. Within IBS, systematic reviews similarly report lower vagally mediated HRV compared with controls, aligning gut symptoms with autonomic dysregulation along the brain–gut axis. (Chalmers et al., 2014; Sadowski et al., 2021; Vezenkov, 2016; Vezenkov & Mitev, 2015)
Quantitative electroencephalography (qEEG) provides a complementary window on cortical dynamics during rest and task‑free states. Prior work in psychiatric populations has reported band‑limited differences (including changes in fast activity) but with notable heterogeneity across studies, emphasizing the need for cautious interpretation and standardized pipelines. Moreover, interpretations of scalp activity above ~20 Hz must account for potential contamination by cranial and facial electromyography (EMG), a point underscored by paralysis studies and recent methodological tutorials demonstrating that high‑frequency scalp power can be heavily influenced by tonic muscle activity despite artifact‑editing. (Newson & Thiagarajan, 2019; Pope et al., 2022)
Against this backdrop, integrating central (qEEG) and peripheral (HRV) readouts in the same recording session offers a practical approach to characterizing cortico‑autonomic states in individual patients with comorbid GAD and IBS. HRV analysis follows established standards and current reporting guidance (e.g., emphasis on RMSSD/HF, cautious use of LF/HF), while qEEG z‑score mapping against age‑adjusted normative databases enables standardized, topographically specific description of deviations from typical activity. Full acquisition and processing details for the present cases - including montage, software, normative references, and HRV pipelines, are described in the Methods section of this manuscript. (Electrophysiology, 1996)
The aim of this report is therefore descriptive and integrative: to illustrate simultaneous qEEG and HRV profiling in two women with GAD and severe IBS at rest, and to situate their individual physiological profiles within contemporary knowledge on brain–gut dysregulation. By presenting paired cortical and autonomic measures acquired concurrently, we seek to highlight a pragmatic framework for future, larger studies that track change over time and test whether modulating autonomic state (e.g., with breathing‑based or behavioral interventions) yields convergent shifts in both HRV and EEG features. (Lehrer et al., 2020)
Methods
Study Design
The evaluation included three key components: (1) a semi-structured clinical interview, (2) quantitative electroencephalography (qEEG), and (3) multimodal assessment of peripheral autonomic nervous system (ANS) activity.
Quantitative EEG (qEEG) Assessment
Electroencephalographic recordings were conducted using a 19-channel monopolar montage with the Neuron-Spectrum-4P system and Neuron-Spectrum.NET software (Neurosoft LLC, Russia). EEG was acquired at sampling rate of 5000 Hz with hardware band‑pass [0,1-100 Hz]. Impedances were kept < 5 kΩ. Data were recorded with the left mastoid (A1) as the online reference and were offline re-referenced to linked ears (A1–A2) to match the NeuroGuide normative reference. Artifact handling used manual inspection and EMG channel checks. Eyes‑closed/open epochs were at least 60 × 3 s, artifact‑free. Z‑scores were computed against the NeuroGuide lifespan database (Thatcher et al., 2003; 2010) age‑adjusted norms.
Quantitative spectral analysis – including the computation of absolute and relative amplitude across standard EEG frequency bands, as well as coherence and phase lag metrics – was carried out within the Neuron-Spectrum.NET environment. For normative comparison, the registered qEEG data were exported and analyzed using NeuroGuide Deluxe 3.3.0 (Applied Neuroscience, Inc., USA), with reference to an age-adjusted normative neurodatabase. Z-scores were computed for each region and frequency band to detect deviations from typical neurophysiological patterns.
Assessment of Autonomic Balance
Peripheral autonomic nervous system signals were recorded using the GP8 Amp 8-channel biofeedback amplifier and Alive Pioneer Plus software (Somatic Vision Inc., USA). The parameters assessed included: Heart Rate (HR); Heart Rate Variability (HRV); Peripheral Skin Temperature; Respiratory Rate; Skin Conductance Level (SCL); Surface Electromyography (EMG); HRV indices – such as SDNN (standard deviation of normal-to-normal intervals), total power, LF/HF ratio, stress index, sympathetic nervous system (SNS) index, and parasympathetic nervous system (PNS) index – were first analyzed in Alive Pioneer Plus and then exported for further processing in Kubios HRV Scientific Lite software (University of Eastern Finland).
Short‑term HRV was recorded for 5 min in seated rest between 9:00-17:00, with 30 min acclimation; participants abstained from caffeine, nicotine, and vigorous exercise for 12 h. Signals were sampled at 1 kHz for HRV analysis. Artifact correction used Kubios HRV v3.4.1, threshold 15%, ectopic removal on (cubic spline interpolation). Spontaneous respiration was measured (chest belt); no paced breathing was used.
Results
Case 1
This is a case study of a 60-year-old woman, a former senior manager at an international company, who left her position due to a severe burnout. She presented with generalized anxiety, a depressive mood, and chronic constipation (defecation every 2–3 days with significant straining). Other symptoms included stress-induced vomiting, abdominal pain in both the upper and lower quadrants, and restless sleep.
Her psychosocial history revealed an authoritarian father, a dependency on authority figures, and a 35-year marriage characterized by her husband's persistent infidelity. She reported a subjective feeling of sexual inadequacy and had an obsessive fixation on a former male colleague with whom she had an online relationship.
Phase 1: Autonomic Preparation and Diagnostic Seeking (Weeks 1–5)
The initial phase of therapy was dominated by intense somatic anxiety. The patient was convinced she had a serious gastrointestinal condition, such as gastritis, colitis, or even stomach cancer. This belief was so strong that the topic of Irritable Bowel Syndrome (IBS) was not addressed for the first five weeks. Instead, the patient independently arranged several medical tests, including gastroscopies and laboratory tests, in an attempt to confirm a severe diagnosis.
During this period, a multimodal biofeedback approach was introduced to monitor heart rate variability (HRV), skin conductance level (SCL), and peripheral temperature. However, the patient did not make a clear connection between the biofeedback exercises and her symptoms.
After receiving clear medical results, the possibility of IBS was discussed for the first time. Initially unfamiliar with IBS, the patient felt both relief (due to the absence of cancer) and uncertainty about the new diagnosis. A referral to a specialist resulted in the diagnosis of IBS type C (constipation-predominant).
Phase 2: Biofeedback Sessions and Psychosexual Fantasies (Weeks 6–10)
In this phase, the patient was assigned homework that included breathing regulation exercises and palpation of painful areas in her abdomen, although her compliance was inconsistent. A turning point occurred not during therapy, but at home, when she experienced a powerful and unusual physical sensation during abdominal palpation, which she described as "something like an orgasm." This was shocking to her, as she had never experienced an orgasm before. She attributed this to a long-held belief that a past gynecological surgery had left her "insensate" and sexually inadequate.
Following this event, sexuality began to dominate her thoughts. The patient became fixated on a former colleague with whom she had an online relationship, which she recalled as a source of intense arousal. These fantasies intensified to the point of obsession, and she considered seeking out this person for physical intimacy.
As a result, the focus of therapy shifted almost entirely to psychosexual dynamics. Despite working on the IBS protocol, the patient’s attention was directed toward her sexual fantasies, which significantly limited her progress on the primary issue of chronic IBS.
Phase 3: Psychosocial Triggers and Incomplete Integration (Weeks 11–14)
In the third phase, the focus shifted toward integrating the learned skills into daily life and building relapse prevention strategies. During this time, suppressed aggression toward her authoritarian father surfaced. She recalled a childhood of severe repression and criticism from her father, while her mother never intervened to protect her. She also noted that her abdominal symptoms (constipation and pain) began during early puberty and had persisted since then.
The patient also reported experiencing symptom-free days for the first time in her life, expressing that she now understood what it felt like to live without constant tension. She blamed her father for her discomfort, which she believed deprived her of a full sense of her body and sexuality, contributing to an inadequate marriage where she felt like a victim of her husband's infidelity and disrespect.
Alongside these realizations, her sexual fantasies about her former colleague intensified and became the focal point of her therapy sessions. She began to miss appointments, and her motivation for systematic work diminished. As a result, the third phase, which should have focused on the consolidation of results, became a period of therapeutic disintegration, and the patient eventually discontinued therapy after the 14th session, stating that she had clarified many things and could now manage on her own, despite the therapist's observation that therapy was in an intermediate stage with unstable progress.
qEEG measurements before therapy
Figure 1-1 presents two representative EEG epochs from a standard 19‑channel 10–20 montage. The left panel depicts the closed‑eyes condition and the right panel the open‑eyes condition. In the closed‑eyes segment, the traces show continuous mixed‑frequency activity with a brief, high‑amplitude deflection that is most evident in anterior channels; otherwise, no prolonged discontinuities are apparent. The open‑eyes segment shows stable, lower‑to‑moderate amplitude mixed‑frequency activity throughout the displayed window. For each epoch, channel‑wise absolute power spectra and Z‑scored absolute power are shown to the right. In both conditions, the absolute spectra exhibit a low‑frequency rise below ~4 Hz and a consistent peak around ~10 Hz, with power declining into higher frequencies. The Z‑score curves increase with frequency above ~13 Hz in both epochs and reach their largest positive deviations in the high‑beta range (approximately 25–30 Hz), with the closed‑eyes epoch showing the greater overall elevation.
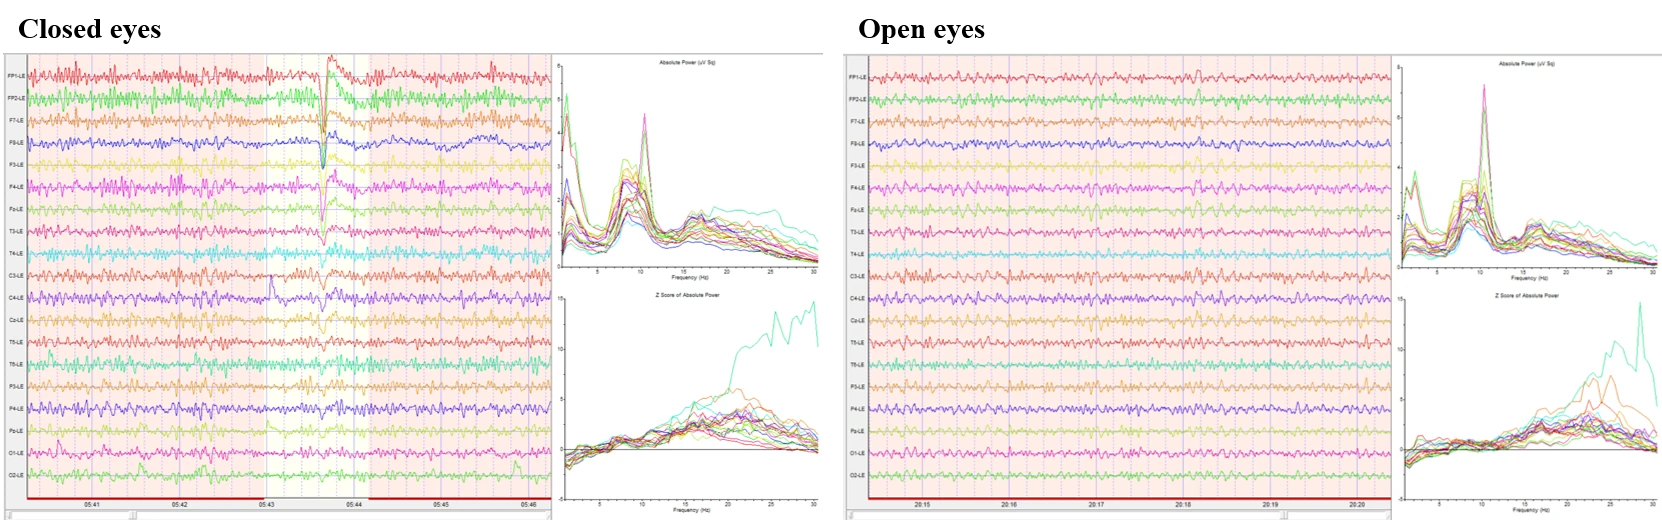
Figure 1-1. Raw EEG, power spectrum, and Z scores in eyes-closed and eyes-open conditions.
Figure 1-2 summarizes Z‑scored FFT topographies for the closed‑eyes condition. Absolute‑power maps show values near zero with mild regional variation in theta (4–8 Hz), and alpha bands (8–12 Hz) that remain close to the reference mean across the scalp. Beta‑range activity (12–25 Hz) is elevated, with Beta1 (12–15 Hz) showing modest diffuse increases and Beta2–Beta3 (15–25 Hz) showing more widespread positive Z‑scores. High‑beta (25–30 Hz) displays the most pronounced elevations, forming patchy maxima over bilateral temporal–posterior regions. Power‑ratio maps indicate globally reduced slow‑to‑fast ratios: Theta/Alpha appears near neutral overall, whereas Theta/Beta and Theta/High‑beta are reduced, most visibly in right posterior–lateral areas. Alpha/Beta and Beta/High‑beta are largely neutral to mildly reduced.
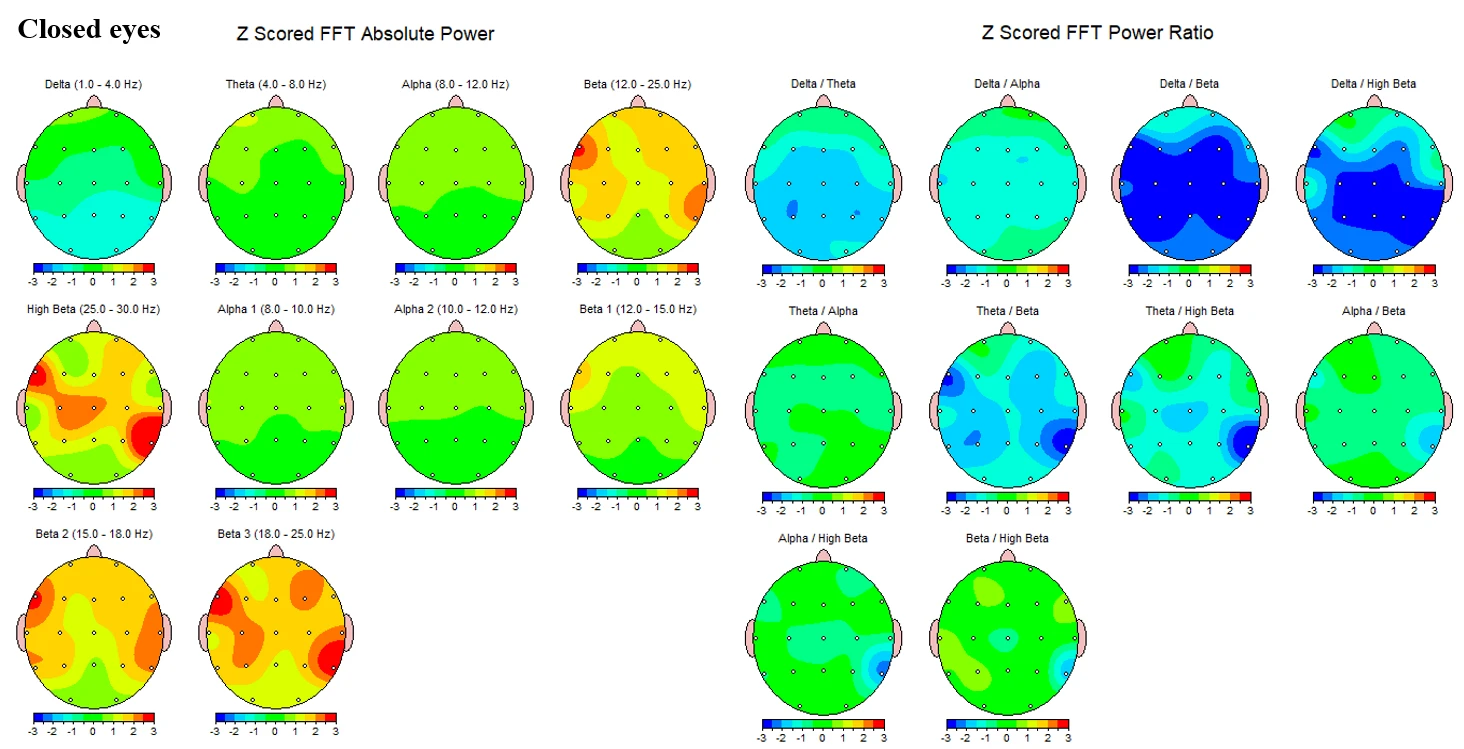
Figure 1-2. Z-scored EEG absolute power and power ratios during eyes-closed condition.
Figure 1-3 presents the corresponding topographies for the open‑eyes condition. Absolute‑power maps again show negative Z‑scores in delta and values near zero in theta. Alpha power is mildly positive overall, with Alpha2 (10–12 Hz) showing small bilateral increases and Alpha1 (8–10 Hz) closer to neutral. Beta activity remains elevated, with diffuse positive Z‑scores across Beta1 and more extensive increases in Beta2-Beta3. High‑beta demonstrates focal positive Z‑scores, again with maxima over bilateral temporal–inferior/posterior sectors. Power‑ratio maps mirror the closed‑eyes pattern. Theta/Alpha is near neutral, while Theta/Beta and Theta/High‑beta show greater reductions in right posterior–lateral regions with milder decreases elsewhere. Alpha/Beta and Beta/High‑beta remain largely neutral to slightly negative.
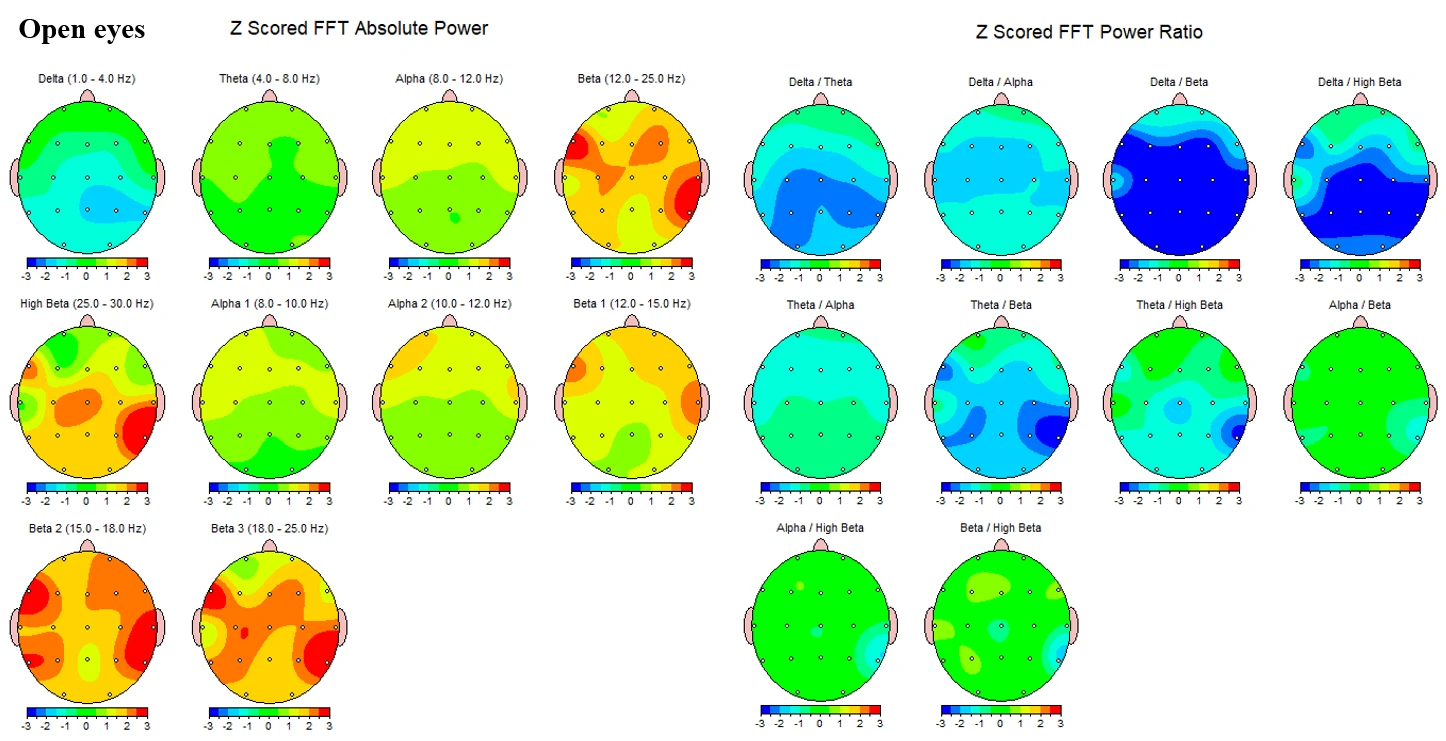
Figure 1-3. Z-scored EEG absolute power and power ratios during eyes-open condition.
Across figures, slow‑band absolute power is consistently below the reference distribution, whereas higher‑frequency bands – most prominently Beta2–Beta3 and High‑beta – are elevated with bilateral temporal–posterior maxima. The spectral line plots in Figure 1 corroborate these topographies, showing progressively increasing Z‑scored absolute power from the low‑beta range into high‑beta, with the largest deviations occurring between ~25 and 30 Hz.
HRV measurements before therapy
Figure 1-4 summarizes Kubios HRV output for the same recording period at rest. The overview panels show standardized autonomic indices referenced to resting norms: the parasympathetic index (PNS Index) was −1.43 and the sympathetic index (SNS Index) was 2.07. The accompanying summary metrics were Mean RR 770 ms, RMSSD 16.8 ms, and SD1 11,9 ms for the PNS panel, and Mean HR 77 bpm, Stress Index 17.3, and SD2 34,7 ms for the SNS panel.
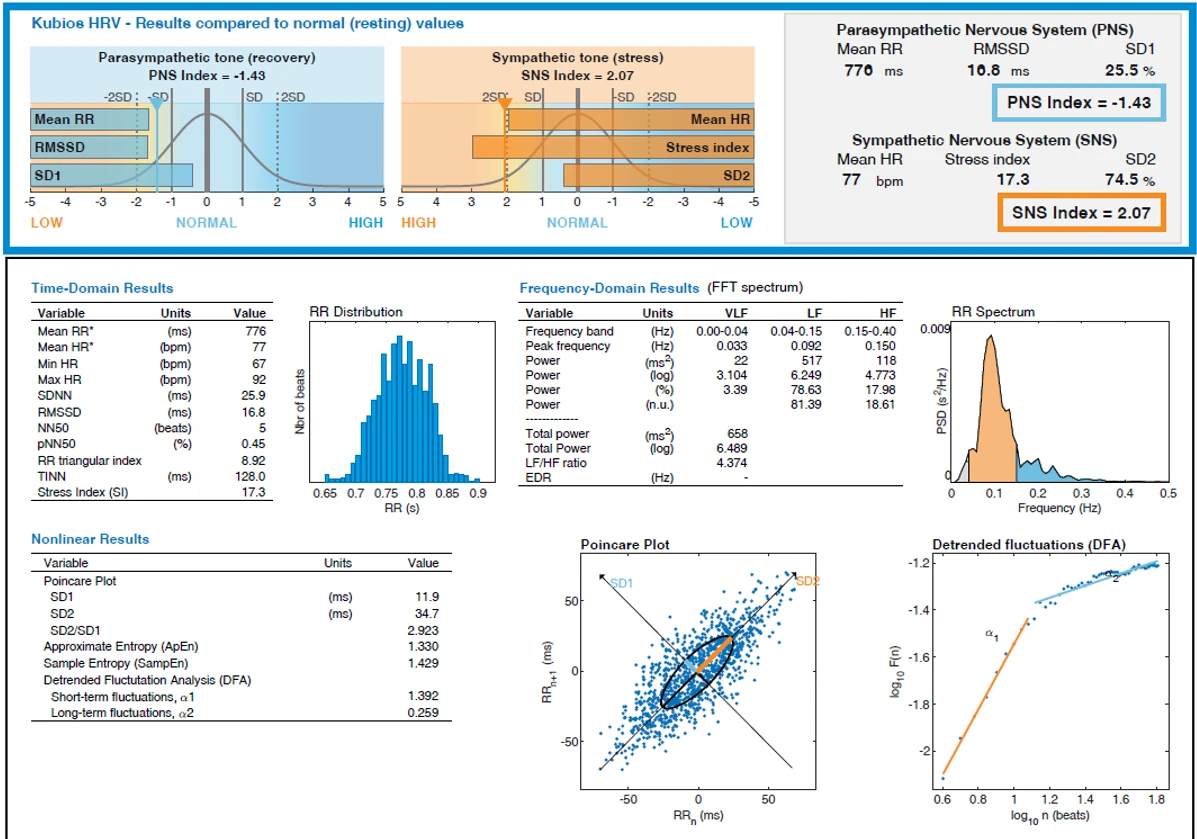
Figure 1-4. Heart Rate Variability (HRV) analysis of subject 1 at rest.
Time‑domain results are presented in Table 1. Mean RR was 776 ms with a mean HR of 77 bpm; the observed heart‑rate range was 67–92 bpm. Variability estimates included SDNN 25.9 ms and RMSSD 16.8 ms. Additional metrics were NN50 5 beats, pNN50 0.45 %, RR triangular index 8.92, TINN 128.0 ms, and Stress Index 17.3.
Table 1-1. Time‑domain HRV (rest)
|
Variable |
Units |
Value |
|
Mean RR* |
ms |
776 |
|
Mean HR* |
bpm |
77 |
|
Min HR |
bpm |
67 |
|
Max HR |
bpm |
92 |
|
SDNN |
ms |
25.9 |
|
RMSSD |
ms |
16.8 |
|
NN50 |
beats |
5 |
|
pNN50 |
% |
1.3 |
|
RR triangular index |
– |
8.92 |
|
TINN |
ms |
128.0 |
|
Stress Index (SI) |
– |
17.3 |
Frequency‑domain measures derived from FFT are detailed in Table 2. Peak frequency occurred at 0.033 Hz in the VLF band, 0.092 Hz in LF, and 0.150 Hz in HF. Absolute band powers were 22 ms² (VLF), 517 ms² (LF), and 118 ms² (HF). Total power was 658 ms² (log total power 6.489), with 78.63 % of power in LF and 17.98 % in HF; normalized units were 81.39 (LF) and 18.61 (HF). The LF/HF ratio was 4.374; EDR was not reported in this output. The RR‑interval spectrum panel depicts a dominant low‑frequency peak with a smaller high‑frequency component.
Table 1-2. Frequency‑domain HRV (rest)
|
Variable |
Units |
VLF (0.00–0.04 Hz) |
LF (0.04–0.15 Hz) |
HF (0.15–0.40 Hz) |
|
Peak frequency |
Hz |
0.033 |
0.092 |
0.150 |
|
Power |
ms² |
22 |
517 |
118 |
|
Power (log) |
– |
3.104 |
6.249 |
4.773 |
|
Power (%) |
% |
3.39 |
78.63 |
17.98 |
|
Power (n.u.) |
– |
– |
81.39 |
18.61 |
|
Totals |
||||
|
Total power |
ms² |
658 |
||
|
Total power (log) |
– |
6.489 |
||
|
LF/HF ratio |
– |
4.374 |
||
|
EDR |
Hz |
– |
Nonlinear results are listed in Table 3. The Poincaré‑plot descriptors were SD1 11.9 ms, SD2 34.7 ms, and SD2/SD1 2.923; the scatter forms an elongated ellipse aligned along the line of identity, as shown in the corresponding panel. Entropy measures were Approximate Entropy 1.330 and Sample Entropy 1.429. Detrended fluctuation analysis yielded short‑term scaling α₁ 1.392 and long‑term scaling α₂ 0.259, with the DFA plot displaying the fitted slopes across the specified ranges. The RR‑interval histogram shows a unimodal distribution centered near 0.78 s over an observed range of approximately 0.65–0.90 s.
Table 1-3. Nonlinear HRV (rest)
|
Variable |
Units |
Value |
|
SD1 |
ms |
11.9 |
|
SD2 |
ms |
34.7 |
|
SD2/SD1 |
– |
2.923 |
|
Approximate Entropy (ApEn) |
– |
1.330 |
|
Sample Entropy (SampEn) |
– |
1.429 |
|
DFA α₁ (short‑term) |
– |
1.392 |
|
DFA α₂ (long‑term) |
– |
0.259 |
Case 2
Symptomatology and Therapeutic Course
This case report involves a 50-year-old woman presenting with involuntary eye tics, severe fatigue, and communication difficulties in the workplace, which had persisted for the past year. Her medical history includes newly diagnosed hypertension (6 months), metabolic syndrome (25 years), anxiety, and insomnia (1 year).
Her psychosocial history revealed emotional estrangement from her children and husband, leading to feelings of disrespect and a lack of attention. She described her husband as passive, lazy, and undermining her in front of their children. Despite a successful career in international management with numerous achievements, she took a one-year sabbatical three months prior to therapy, citing a need for a break from the "toxicity" of the business world and a desire to pursue professional reorientation.
Phase 1: Initiation of Therapy (Weeks 1–5)
Therapy commenced with biofeedback training aimed at stress regulation and improving autonomic flexibility. The patient, however, struggled to focus and frequently interrupted the exercises with lengthy narratives, sharing memories and stories from various periods of her life. She showed a lack of cooperation, often speaking when asked to remain silent and failing to complete homework assignments. She provided excuses, labeling the exercises as strange or claiming to have forgotten them. This pattern continued for almost four weeks.
A key turning point occurred when the patient expressed a strong desire to lose 10 kg. She described years of failed diets, where initial motivation was quickly followed by episodes of emotional eating and bingeing, disrupting her regimen. She attributed these issues to "poor peristalsis." Following a referral to a specialist, she was diagnosed with IBS type C (constipation-predominant).
Phase 2: Biofeedback and Psychosocial Exploration (Weeks 5–10)
At this stage, work began on an IBS protocol incorporating biofeedback and interoceptive exposure. Several areas of tension in her abdomen were identified, but she did not initially recognize these as problems, attributing them instead to "gaining weight." She claimed to follow all homework instructions, though inconsistencies persisted.
Following a party where she wore tight clothing, she experienced a severe abdominal crisis with intense pain requiring high doses of painkillers, which heightened her anxiety. Abdominal exercises were temporarily suspended, but she continued with autonomic balance regulation training.
During subsequent sessions, deeper emotional themes emerged, such as a sense of constant underestimation and invalidation in her professional life despite her successes, as well as a desire to leave her husband, whom she neither loved nor respected. She also revealed a long-standing pattern of self-punishment through wearing tight, uncomfortable clothing daily, which she admitted was a way to punish her body for its appearance.
Phase 3: Disengagement and Incomplete Progress (Weeks 10–13)
By the tenth week, the patient began missing sessions. She noted days without abdominal discomfort, but during her exercises, she often self-inflicted pain, exhibiting self-punishing behavior. Despite instructions for gentle massage, she continued to injure herself.
Positive changes were observed: her tics and generalized anxiety decreased. However, therapy was discontinued after the 13th session at the patient's initiative, without a stable consolidation of results.
EEG measurements before therapy
The left panel of Figure 2-1 depicts the closed‑eyes epoch and the right panel the open‑eyes epoch, both recorded with a 19‑channel 10–20 montage. In the closed‑eyes segment the tracings show continuous, mixed‑frequency activity with intermittent ocular transients in anterior leads and low‑frequency waves of higher amplitude over posterior channels. The corresponding absolute power spectra are dominated by low‑frequency power below ~4 Hz with a clear peak in the ~8–12 Hz range and smaller shoulders extending into beta. The Z‑scored spectra rise from the low‑beta range and display a broad elevation centered in mid‑ to high‑beta, with several channels reaching the highest Z‑scores above ~20 Hz. In the open‑eyes segment the background amplitude is lower and more uniformly distributed across channels, with brief anterior deflections at the beginning and end of the window. The absolute spectra maintain a steep low‑frequency fall‑off with a comparatively smaller alpha‑range prominence; Z‑scored spectra again increase across beta, peaking in the high‑beta band, with channel‑to‑channel dispersion visible at 20–30 Hz.
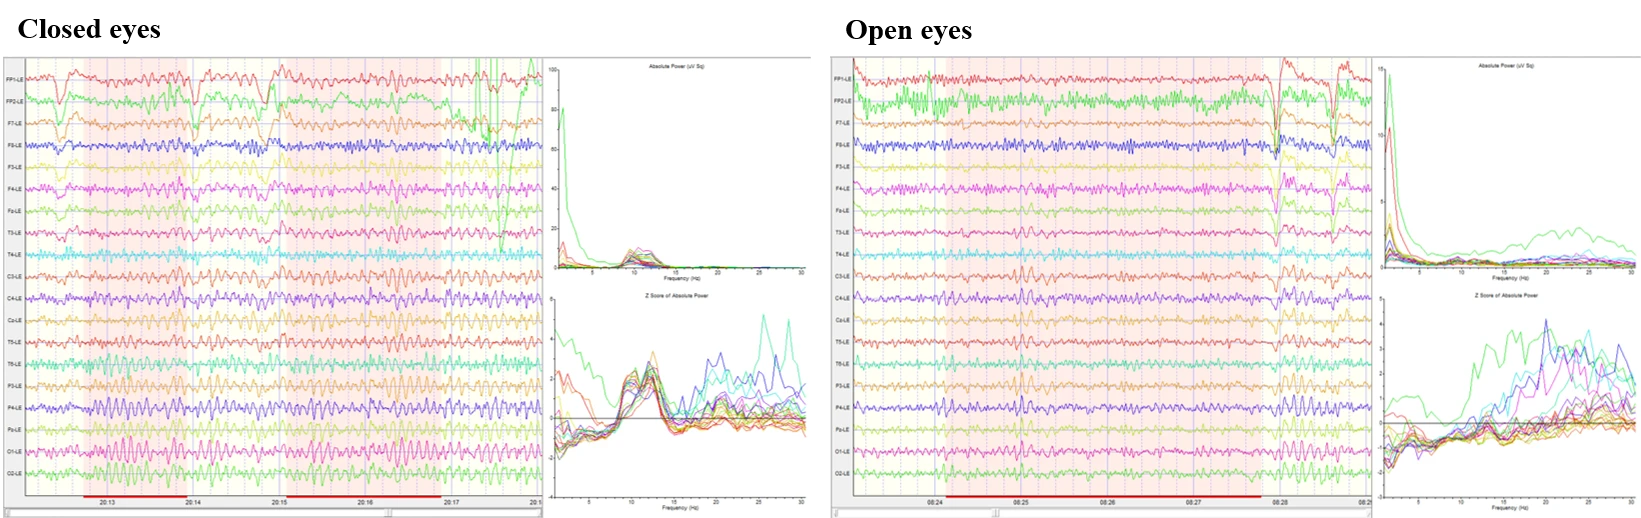
Figure 2-1. Raw EEG, power spectrum, and Z scores in eyes-closed and eyes-open conditions.
Z‑scored FFT absolute‑power maps in Figure 2-2 (scale −3 to +3 Z) show delta with a focal positive area over the left frontal/superior region and relative reductions over posterior‑inferior scalp. Theta is near neutral overall with mild negativity centrally and posteriorly and small positive values frontally. Alpha (8–12 Hz) is largely close to the reference mean with subtle hemispheric asymmetries. Beta (12–25 Hz) displays mild, diffuse positive Z‑scores, with Beta1 (12–15 Hz) and Beta2 (15–18 Hz) showing small, patchy increases; Beta3 (18–25 Hz) is slightly more prominent over lateral/posterior regions. High‑beta (25–30 Hz) shows localized positive Z‑scores, most evident over inferior–temporal/posterior scalp on the right. Power‑ratio maps for the same epoch demonstrate higher Delta/Theta and Delta/Alpha over the left frontal/superior area and lower values posteriorly. Ratios that contrast slow with fast activity (Delta/Beta and Delta/High‑beta) are reduced over much of the right posterior quadrant with relative increases anteriorly. Theta/Alpha is lower over central‑posterior scalp, and Theta/Beta and Theta/High‑beta are lowest in right posterior–lateral regions. Alpha/Beta and Alpha/High‑beta are mildly elevated anteriorly with lower values posteriorly.
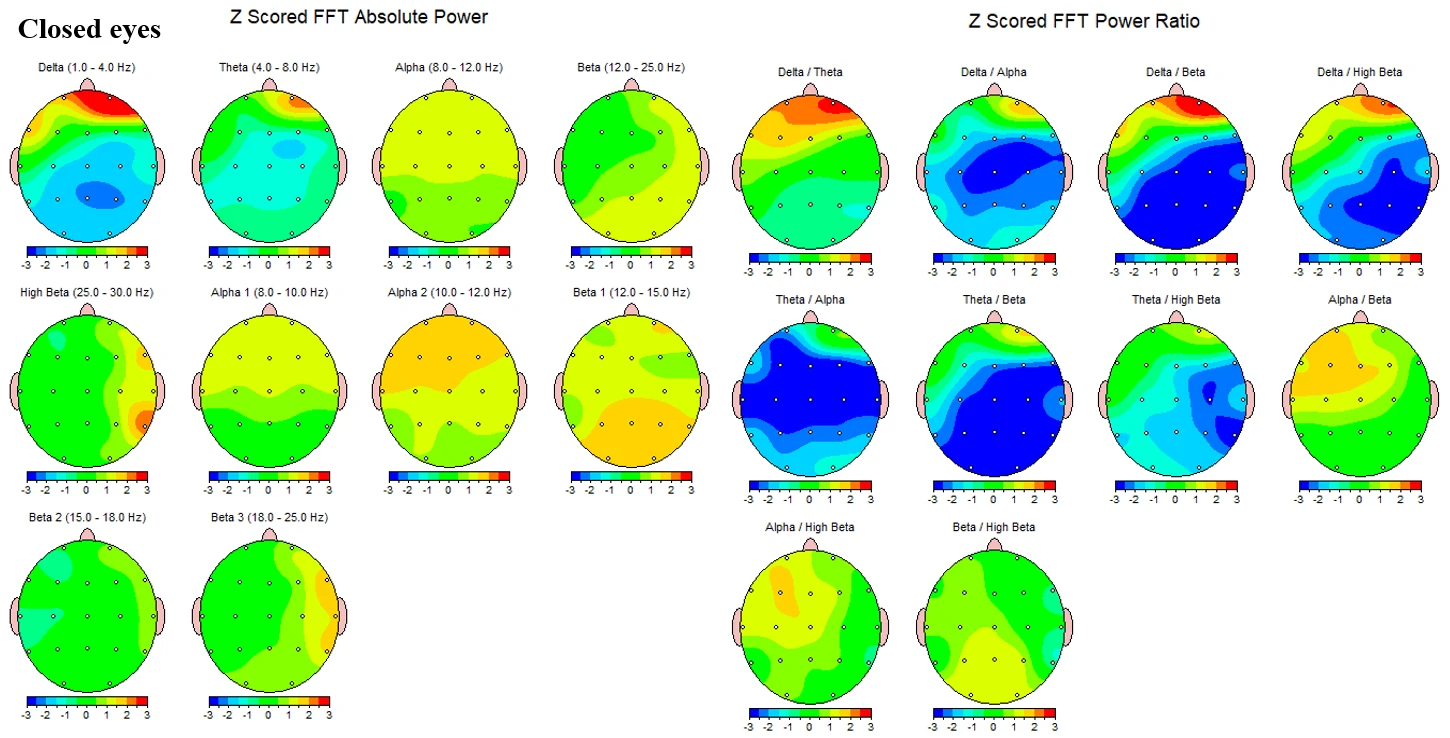
Figure 2-2. Z-scored EEG absolute power and power ratios during eyes-closed condition.
Z‑scored absolute‑power maps in Figure 2-3 during open eyes show delta broadly negative across the scalp with the least negative values frontally. Theta remains near neutral with small regional gradients. Alpha is close to neutral overall. Beta power exhibits focal positive Z‑scores maximal over the right parietal–occipital quadrant; this pattern is present in Beta1 and becomes more circumscribed and intense in Beta2 and Beta3. High‑beta shows patchy, mild increases with small foci over left frontal and right parietal areas. In the corresponding power‑ratio maps Theta/Beta and Theta/High‑beta show reduced values over right posterior–lateral scalp and relatively higher values anteriorly. Alpha/Beta is mildly higher over left central/anterior regions and lower posteriorly. Beta/High‑beta is near neutral with small regional variations.
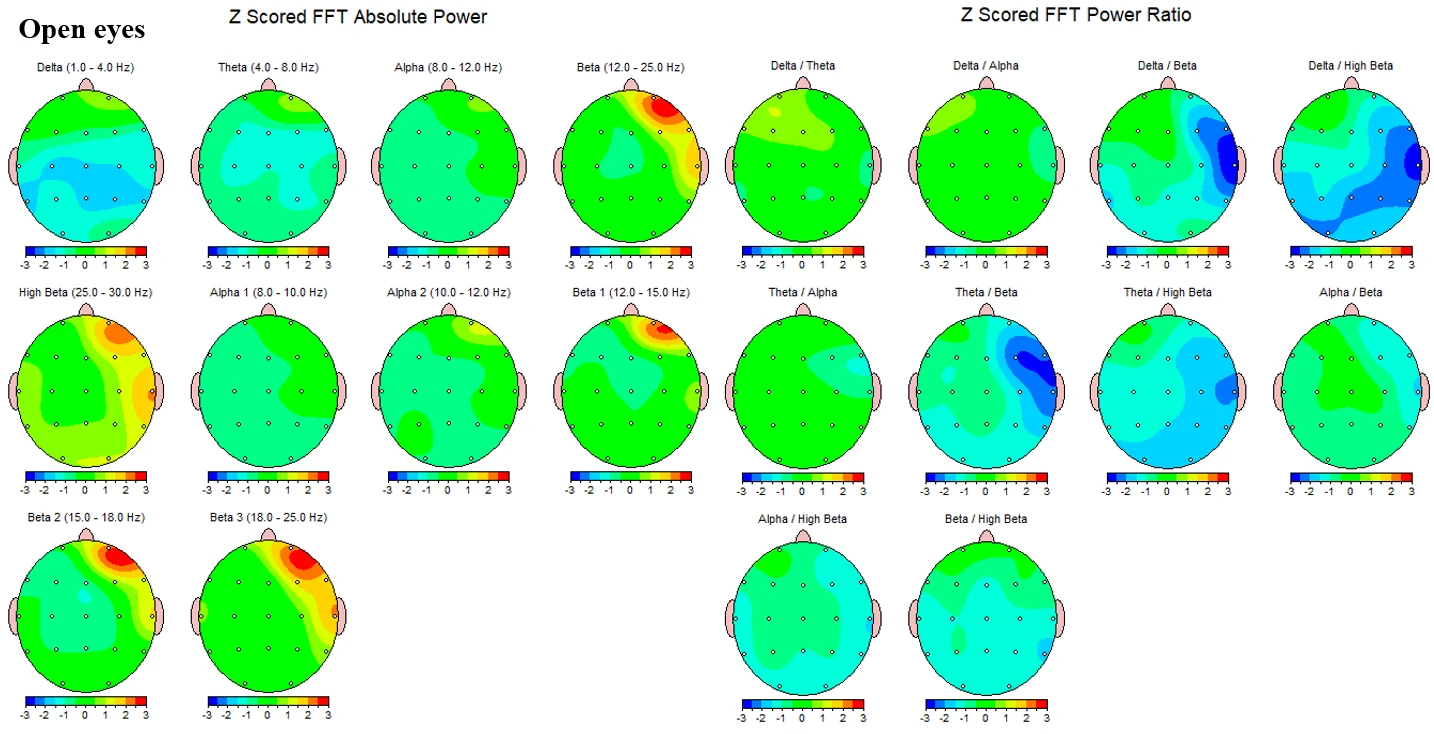
Figure 2-3. Z-scored EEG absolute power and power ratios during eyes-open condition.
Taken together, the closed‑ and open‑eyes figures show continuous backgrounds in both states, alpha‑range spectral prominence that is larger with eyes closed than open, and Z‑scored spectral elevations that develop from low‑beta upward with maximal values in high‑beta, accompanied by topographic foci that vary by condition as detailed above.
HRV measurements before therapy
Kubios HRV summary panels report a Parasympathetic Nervous System (PNS) index of −1.44 and a Sympathetic Nervous System (SNS) index of 2.14. The accompanying overview values are shown in Table A. The RR‑interval histogram depicts a unimodal distribution centered near 0.78 s over an observed span of approximately 0.65–0.85 s. The RR spectrum shows distinct low‑frequency components with smaller high‑frequency content. The Poincaré scatter is elongated with an elliptical fit; detrended fluctuation analysis (DFA) displays the short‑ and long‑term scaling fits over the indicated ranges. (Table 2-1.)
Table 2-1. Overview metrics (Kubios summary panels)
|
System |
Variable |
Units |
Value |
|
PNS |
Mean RR |
ms |
768 |
|
PNS |
RMSSD |
ms |
16.2 |
|
PNS |
PNS Index |
– |
−1.44 |
|
SNS |
Mean HR |
bpm |
78 |
|
SNS |
Stress index |
– |
17.7 |
|
SNS |
SNS Index |
– |
2.14 |
Table 2-2. Time‑domain HRV
|
Variable |
Units |
Value |
|
Mean RR* |
ms |
768 |
|
Mean HR* |
bpm |
78 |
|
Min HR |
bpm |
71 |
|
Max HR |
bpm |
90 |
|
SDNN |
ms |
21.8 |
|
RMSSD |
ms |
16.2 |
|
NN50 |
beats |
2 |
|
pNN50 |
% |
0.20 |
|
RR triangular index |
– |
6.64 |
|
TINN |
ms |
124.0 |
|
Stress Index (SI) |
– |
17.7 |
Resting, beat‑to‑beat vagal indices are low for midlife adults: RMSSD 16.2 ms, HF power 97 ms², and HF(n.u.) 24 %. The Kubios PNS Index −1.44 (relative to resting norms) points in the same direction. The SD1 of the Poincaré plot (11.5 ms), which mirrors RMSSD, is likewise reduced. Together these metrics indicate attenuated short‑latency vagal control of the sinoatrial node at rest. (Table 2-2., Table 2-3.)
Table 2-3. Band powers and totals.
|
Variable |
Units |
VLF (0.00–0.04 Hz) |
LF (0.04–0.15 Hz) |
HF (0.15–0.40 Hz) |
|
Peak frequency |
Hz |
0.033 |
0.092 |
0.150 |
|
Power |
ms² |
51 |
306 |
97 |
|
Power (log) |
– |
3.936 |
5.725 |
4.573 |
|
Power (%) |
% |
11.27 |
67.41 |
21.30 |
|
Power (n.u.) |
– |
– |
75.98 |
24.00 |
|
Totals |
Units |
Value |
||
|
Total power (VLF+LF+HF) |
ms² |
455 |
||
|
Total power (log) |
– |
6.119 |
||
|
LF/HF ratio |
– |
3.166 |
||
|
EDR |
Hz |
– |
The balance of power is shifted toward slower oscillations: LF 67 % (LF(n.u.) ≈ 76) with LF/HF ≈ 3.2 and SNS Index 2.14. While LF/HF is not a pure “sympathovagal balance” measure, this constellation—elevated LF share, low HF share, and higher stress index—supports a resting state biased toward sympathetic drive and reduced vagal counter‑regulation.
Table 2-4. Poincaré‑ and DFA‑derived metrics.
|
Variable |
Units |
Value |
|
SD1 |
ms |
11.5 |
|
SD2 |
ms |
28.6 |
|
SD2/SD1 |
– |
2.494 |
|
Approximate Entropy (ApEn) |
– |
1.515 |
|
Sample Entropy (SampEn) |
– |
1.745 |
|
DFA α₁ (short‑term) |
– |
1.370 |
|
DFA α₂ (long‑term) |
– |
0.519 |
Short‑term total power 455 ms² and SDNN 21.8 ms are on the low side for a quiet, artifact‑free 5‑min recording, indicating restricted overall variability. The Poincaré geometry shows an elongated ellipse with SD2/SD1 = 2.49, emphasizing longer‑term variance (SD2) relative to short‑term vagal variance (SD1), a pattern often seen when vagal modulation is comparatively weak. (Table 2-4)
Nonlinear markers suggest reduced flexibility of autonomic regulation: DFA α₁ = 1.37 (greater than unity) reflects more persistent short‑term dynamics and less adaptable moment‑to‑moment control; DFA α₂ = 0.52 indicates blunted long‑range correlations. Entropy values (ApEn, SampEn) are in a moderate range rather than high, consistent with less complex HR dynamics. (Fig. 2-4)
Figure 2-4. Heart Rate Variability (HRV) analysis of subject 2 at rest.
The HF peak at 0.150 Hz implies a spontaneous respiratory rate around 9 breaths/min. The pronounced LF peak at 0.092 Hz lies near the baroreflex “resonance” frequency (~0.1 Hz). If breathing occasionally slows toward this range, LF power will inflate and HF will shrink, accentuating the LF/HF asymmetry even when the underlying vagal tone is low—worth considering when comparing across sessions.
Putting the pattern together – low vagal indices (RMSSD/HF), elevated SNS‑leaning composites (SNS Index, Stress Index), reduced total power, and less complex fractal dynamics—the recording depicts a resting high‑arousal autonomic state. In the context of GAD, this matches the classic physiology of chronic hypervigilance with vagal withdrawal. In severe IBS, diminished vagal modulation and relative sympathetic predominance are frequently observed and are relevant to gut motility, visceral sensitivity, and pain signaling along the brain–gut axis.
Discussion
The two cases—a 60-year-old woman (Case 1) and a 50-year-old woman (Case 2)—demonstrate the complex interrelationship between irritable bowel syndrome (IBS), generalized anxiety disorder (GAD), and significant psychosocial factors. In both patients, somatic complaints (chronic constipation, abdominal pain, and crisis episodes) were found to be intricately linked to personality dynamics, long-standing stress, and patterns of physical and emotional self-punishment.
Case 1 initially presented with overwhelming somatic anxiety, which, over time, shifted focus to psychosexual fantasies and fixations that disrupted the therapeutic attention from IBS symptoms. In the later stages, unresolved conflicts with parental figures and traumatic childhood experiences were activated, perpetuating the feeling of an "unlived life" and further fueling obsessive dynamics. In contrast, Case 2 exhibited behavioral difficulties such as an inability to concentrate, failure to follow instructions, and a chronic cycle of restrictive dieting followed by emotional overeating. During therapy, she became aware of self-tormenting behaviors, such as wearing uncomfortable clothing, which symbolized her internal insecurity and need for control over her body. The IBS symptoms in this case were closely tied to body-dysmorphic attitudes and unsuccessful attempts at self-regulation through dieting.
Despite these differences in presentation, a common therapeutic challenge emerged in both cases: the premature discontinuation of therapy (after 13-14 sessions), resulting in incomplete consolidation of therapeutic progress. Both patients exhibited emotional-personal deficits, including impaired partner relationships, a sense of disrespect and lack of support from loved ones, and a long-standing feeling of being undervalued in their personal or professional lives.
In both women with generalized anxiety disorder (GAD) and severe irritable bowel syndrome (IBS), the combined EEG and HRV findings depict a consistent hyperarousal phenotype that spans cortical and autonomic levels. The conventional EEG background was age-appropriate and reactive, yet quantitative maps and spectra revealed a broad elevation of beta activity—most marked in the 25–30 Hz range—across bilateral temporal–posterior regions, with relatively reduced delta and alpha/theta bands. Resting HRV, assessed during the same session, revealed low vagally mediated indices (RMSSD, HF power), a high LF/HF ratio, and an elevated SNS index, all indicative of parasympathetic withdrawal with relative sympathetic dominance.
Relation to current evidence on anxiety
The subjective symptoms and physiological findings in these cases present an interesting correlation. In Case 1, anxiety manifested as hypochondriacal beliefs and later shifted toward obsessive psychosexual fantasies, while in Case 2, it was expressed through inability to concentrate, chronic emotional eating, and self-punishing behavior. Despite differences in clinical presentation, both cases shared a similar physiological signature: decreased parasympathetic activity and increased sympathetic tone, supporting the hypothesis of a common cortico-autonomic mechanism underlying various forms of psychopathology.
Resting EEG studies in anxiety increasingly report alterations in fast activity, with several investigations in GAD describing higher beta power and altered functional connectivity relative to controls; however, findings across the anxiety spectrum are heterogeneous and often modest in effect size. In particular, large cross‑disorder reviews emphasize that resting‑state band‑limited power changes are not unique to a single diagnosis and show considerable between‑study variability, cautioning against over‑interpretation of spectral band elevations in isolation. In our case, the prominence of high‑beta together with preserved alpha reactivity fits a cortical hyperarousal profile consistent with anxiety, while also underscoring the need to consider alternative generators and artifacts when interpreting fast activity.(Newson & Thiagarajan, 2019; H. Wang et al., 2025; J. Wang et al., 2022)
A critical caveat is that scalp power above ~20 Hz is easily contaminated by cranial and facial electromyography (EMG). Paralysis studies and methodological tutorials demonstrate that EMG can dominate the 20–80 Hz range in scalp recordings and often produces edge‑maximal topographies resembling the temporal predominance seen here. Accordingly, although sustained high‑beta power is compatible with cortical hypervigilance in anxiety, part of the observed excess almost certainly reflects EMG, especially given the temporal–inferior emphasis in the maps. (Muthukumaraswamy, 2013; Pope et al., 2022; Whitham et al., 2007)
Modern neurovisceral integration models propose that lower HRV reflects weakened prefrontal control over limbic and brainstem structures, leading to decreased cognitive and emotional flexibility and the maintenance of a chronic hypervigilance state. Both cases display difficulty in shifting attention, fixating on specific topics, and displaying rigid behavioral patterns—traits that align with low HRV. Autonomic dysregulation here supports the hypothesis that low HRV is not only a biomarker of anxiety but also a predictor of difficult therapeutic engagement and increased risk of treatment dropout, as observed in both cases.
Furthermore, the clinical course of these therapies shows that autonomic dysregulation intertwines with personal and psychodynamic conflicts, making treatment vulnerable to premature discontinuation. In Case 1, the therapeutic focus shifted to obsessive sexual fantasies, while in Case 2, it shifted to chronic patterns of dieting and body control. In both instances, anxiety continued to be "fed" by sympathetic dominance and low HRV. This aligns with data indicating that low HRV is not only an indicator of anxiety but also a predictor of more difficult therapeutic engagement and a higher risk of dropping out of treatment (Lehrer et al., 2020).
Autonomic dysregulation and anxiety
The HRV profile aligns closely with contemporary meta‑analytic evidence in anxiety disorders, which shows small‑to‑moderate reductions in vagally mediated HRV (HF power, RMSSD) across GAD, panic disorder, PTSD, and social anxiety, independent of medication and comorbidity. More recent work continues to confirm reduced vagal indices in clinical anxiety. Taken together, our patient’s reduced RMSSD and HF power during quiet rest are consistent with the broader literature linking anxiety to impaired cardiac vagal regulation. (Chalmers et al., 2014; Tomasi et al., 2024)
Within mechanistic frameworks, these findings map onto the neurovisceral‑integration model, which posits that prefrontal–limbic circuits governing emotion and attention exert tonic inhibitory control over subcortical threat systems and cardiac vagal output; lower resting HRV is interpreted as a surrogate of weaker top‑down regulatory capacity. The observed low RMSSD/HF and high LF/HF (noting the limitations of LF/HF below) thus comport with a state of reduced prefrontal inhibitory control and heightened autonomic vigilance typical of chronic anxiety. (Jennings et al., 2015; Thayer et al., 2009)
Furthermore, reduced vagal tone in these cases may amplify comorbid somatic conditions, such as IBS. Vagal withdrawal compromises anti-inflammatory pathways and visceral homeostasis, potentially increasing gut sensitivity, motility disturbances, and pain amplification. This is consistent with the findings that both patients, despite different psychosocial trajectories, presented with IBS type C, chronic abdominal discomfort, and exaggerated stress reactivity. (Jennings et al., 2015; Thayer et al., 2009).
Clinically, this framework maps directly onto the case narratives. Case 1 exhibited difficulty shifting away from intrusive health-related fears and later from obsessive psychosexual fantasies, reflecting cognitive-emotional rigidity consistent with low HRV. Case 2 displayed repetitive cycles of restrictive dieting followed by loss of control, alongside compulsive use of tight clothing that caused physical discomfort—a behavioral analogue of diminished self-regulatory flexibility. In both cases, reduced HRV indices parallel their difficulty disengaging from maladaptive patterns, supporting the view that autonomic dysregulation is not peripheral “noise” but a core substrate of anxiety symptomatology.
A further implication is that reduced vagal tone in anxiety may amplify comorbid somatic conditions, such as IBS. Vagal withdrawal compromises anti-inflammatory pathways and visceral homeostasis, potentially heightening gut sensitivity, motility disturbances, and pain amplification. This resonates with our findings that both patients—despite different psychosocial trajectories—presented with IBS type C, chronic abdominal discomfort, and exaggerated stress reactivity. Their shared HRV phenotype thus bridges psychological and somatic domains, reinforcing the concept of anxiety and IBS as interconnected expressions of brain–gut–autonomic dysregulation.
Finally, it is worth noting that while LF/HF ratio was elevated in both cases, contemporary scholarship cautions against overinterpreting this metric as a pure index of sympathovagal balance (Billman, 2013). Nevertheless, when considered alongside uniformly reduced vagal indices (RMSSD, HF power) and elevated stress indices, the overall profile converges on a state of persistent autonomic hypervigilance. Such a state is increasingly regarded not only as a biomarker of anxiety but also as a risk factor for poor therapeutic engagement and premature dropout, as observed in both patients.
IBS, the brain–gut axis, and autonomic tone
IBS is increasingly conceptualized as a disorder of brain–gut–microbiome interactions characterized by bidirectional alterations in central networks, autonomic regulation, immune signaling, and the enteric nervous system. Psychiatric comorbidity, particularly anxiety, is common, and central pain‑modulation circuits are frequently implicated. Our subject’s low vagal indices and relative sympathetic predominance replicate meta‑analytic observations in IBS, where HF power tends to be reduced compared with healthy controls, especially in short‑duration laboratory recordings. These data provide physiological support for a brain–gut axis model in which chronic hyperarousal and vagal withdrawal contribute to altered visceral sensitivity, motility, and symptom amplification. (Mayer et al., 2023; Sadowski et al., 2021)
Methodological considerations for interpretation
Although LF/HF is commonly reported, contemporary analyses warn that it is not a reliable measure of “sympathovagal balance.” Accordingly, interpretation should emphasize RMSSD and HF power as primary vagal markers, with LF/HF treated cautiously. Age also influences HRV; normative studies show progressive declines across adulthood, so low absolute values must be considered in that context—yet the pattern here (low RMSSD/HF with elevated stress index) remains directionally consistent with autonomic dysregulation beyond aging effects alone. On the EEG side, the coexistence of elevated beta with edge‑predominant topography and high‑frequency Z‑score inflation reinforces the need to account for EMG when linking fast power to cortical generators. (Billman, 2013; Nunan et al., 2010)
Clinical and translational implications
The convergence of cortical (EEG) and autonomic (HRV) findings in this patient points to a persistent high‑arousal state marked by increased fast‑band activity and vagal withdrawal—an endophenotype reported across anxiety disorders and IBS. Interventions that bolster prefrontal regulation and vagal tone therefore have particular face validity. Randomized trials and meta‑analyses indicate that HRV biofeedback and slow‑paced breathing at ~0.1 Hz can increase vagally mediated HRV and reduce anxiety/stress symptoms, while brain–gut–focused psychotherapies such as cognitive‑behavioral therapy (CBT), mindfulness‑based stress reduction (MBSR), and gut‑directed hypnotherapy improve IBS symptom burden and psychological indices. Evidence for non‑invasive auricular vagus‑nerve stimulation (taVNS) on HRV is mixed, with meta‑analytic work questioning HRV as a robust acute biomarker of taVNS, though parameter‑specific and age‑dependent effects have been reported; thus taVNS remains investigational in this context. (Gianlorenço et al., 2024; Lehrer et al., 2020, 2020; Pizzoli et al., 2021)
Synthesis
In summary, the patients’ EEG and HRV portray a brain–body milieu of chronic hypervigilance: a largely normal, reactive cortical background with superimposed fast‑band predominance (partly artifactual, partly trait‑related) and a resting autonomic state of low cardiac vagal modulation with relative sympathetic predominance. This pattern accords with contemporary models of anxiety and IBS as disorders of cortico‑autonomic dysregulation within the brain–gut axis and provides biologically grounded targets – enhancing prefrontal control and vagal tone—for symptom management strategies. (Mayer et al., 2023; Thayer et al., 2009)
Conclusions
This report presents two cases of women with generalized anxiety disorder (GAD) and severe irritable bowel syndrome (IBS)—Case 1 (60 years old) and Case 2 (50 years old) – who exhibited consistent cortical and autonomic signatures of heightened arousal. Both patients’ EEG findings showed age-appropriate posterior dominant alpha rhythms, which were reactive to eye opening and free from epileptiform discharges or focal slowing. However, both cases demonstrated a dominance of fast activity that escalated from low to high beta, with Case 1 showing maxima over bilateral temporal–posterior regions and Case 2 showing a right-posterior accentuation during eye opening. Power-ratio maps in both patients revealed low slow/fast ratios, reinforcing the hyperarousal phenotype seen across both cases.
Heart rate variability (HRV) measurements acquired concurrently characterized both patients with low vagal indices and relatively higher low-frequency power. Both exhibited a negative parasympathetic (PNS) index and positive sympathetic (SNS) index, alongside low RMSSD, low HF power, modest total spectral power, and elongated Poincaré ellipses (SD2 > SD1). The elevated LF power (peaking around 0.09–0.10 Hz) replicated patterns of vagal withdrawal and sympathetic predominance, which are commonly observed in both anxiety and IBS. Together, these cross-modal findings – high-frequency EEG predominance and reduced vagal tone – reflect a coherent physiological profile of cortico-autonomic dysregulation shared across both GAD and IBS cases.
Beyond the physiological data, the clinical narratives provided further context. Case 1 demonstrated early somatic preoccupations that were later displaced by psychosexual fantasies and family-of-origin conflicts, which diverted attention away from IBS symptom management. Case 2, on the other hand, exhibited a persistent struggle with self-regulation, marked by a cycle of restrictive dieting followed by emotional overeating, and a long-standing pattern of self-punishment through tight clothing. In both cases, the physiological signatures of hypervigilance mirrored their rigid cognitive-emotional styles, which ultimately contributed to premature discontinuation of therapy (after 13–14 sessions), preventing the consolidation of any therapeutic gains.
From a clinical perspective, these cases underscore that neurophysiological hyperarousal is not just an abstract physiological correlate but a practical barrier to flexible engagement in therapy. Reduced vagal tone and elevated beta activity seem to exacerbate maladaptive attentional and behavioral loops, creating a predisposition for therapy dropout and incomplete recovery. These findings highlight the necessity of integrative treatment strategies that directly address both autonomic regulation (e.g., HRV biofeedback, paced breathing, vagus-nerve-directed interventions) and psychosocial drivers of rigidity (e.g., trauma-informed psychotherapy, emotion-focused therapy, mindfulness-based interventions).
The present report contributes to the understanding of cortico-autonomic dysregulation in comorbid GAD+IBS, documenting stable, cross-sectional EEG–HRV profiles that converge on a hyperarousal endophenotype. Additionally, it demonstrates the value of embedding physiological phenotyping within clinical trajectories, offering insights into how complex cases can be understood and treated. Future research should prioritize longitudinal designs with retention strategies, enabling assessment of how cortico-autonomic signatures change in response to multimodal interventions. Such studies could clarify whether improvements in vagal regulation and cortical rhythms correlate with clinical recovery, and whether they may serve as biomarkers for treatment engagement and prognosis in patients with comorbid anxiety and gut-brain disorders.
References
Billman, G. E. (2013). The LF/HF ratio does not accurately measure cardiac sympatho-vagal balance. Frontiers in Physiology, 4. https://doi.org/10.3389/fphys.2013.00026
Chalmers, J. A., Quintana, D. S., Abbott, M. J.-A., & Kemp, A. H. (2014). Anxiety Disorders are Associated with Reduced Heart Rate Variability: A Meta-Analysis. Frontiers in Psychiatry, 5. https://doi.org/10.3389/fpsyt.2014.00080
Electrophysiology, Task Force of the European Society of Cardiology and the North American Society of Pacing and Electrophysiology. (1996). Heart Rate Variability: Standards of Measurement, Physiological Interpretation, and Clinical Use. Circulation, 93(5), 1043–1065. https://doi.org/10.1161/01.CIR.93.5.1043
Gianlorenço, A. C., Pacheco-Barrios, K., Daibes, M., Camargo, L., Choi, H., Song, J.-J., & Fregni, F. (2024). Age as an Effect Modifier of the Effects of Transcutaneous Auricular Vagus Nerve Stimulation (taVNS) on Heart Rate Variability in Healthy Subjects. Journal of Clinical Medicine, 13(14), 4267. https://doi.org/10.3390/jcm13144267
Jennings, J. R., Allen, B., Gianaros, P. J., Thayer, J. F., & Manuck, S. B. (2015). Focusing neurovisceral integration: Cognition, heart rate variability, and cerebral blood flow. Psychophysiology, 52(2), 214–224. https://doi.org/10.1111/psyp.12319
Lehrer, P., Kaur, K., Sharma, A., Shah, K., Huseby, R., Bhavsar, J., Sgobba, P., & Zhang, Y. (2020). Heart Rate Variability Biofeedback Improves Emotional and Physical Health and Performance: A Systematic Review and Meta Analysis. Applied Psychophysiology and Biofeedback, 45(3), 109–129. https://doi.org/10.1007/s10484-020-09466-z
Mayer, E. A., Ryu, H. J., & Bhatt, R. R. (2023). The neurobiology of irritable bowel syndrome. Molecular Psychiatry, 28(4), 1451–1465. https://doi.org/10.1038/s41380-023-01972-w
Muthukumaraswamy, S. D. (2013). High-frequency brain activity and muscle artifacts in MEG/EEG: A review and recommendations. Frontiers in Human Neuroscience, 7. https://doi.org/10.3389/fnhum.2013.00138
Newson, J. J., & Thiagarajan, T. C. (2019). EEG Frequency Bands in Psychiatric Disorders: A Review of Resting State Studies. Frontiers in Human Neuroscience, 12, 521. https://doi.org/10.3389/fnhum.2018.00521
Nunan, D., Sandercock, G. R. H., & Brodie, D. A. (2010). A Quantitative Systematic Review of Normal Values for Short-Term Heart Rate Variability in Healthy Adults: REVIEW OF SHORT-TERM HRV VALUES. Pacing and Clinical Electrophysiology, 33(11), 1407–1417. https://doi.org/10.1111/j.1540-8159.2010.02841.x
Pizzoli, S. F. M., Marzorati, C., Gatti, D., Monzani, D., Mazzocco, K., & Pravettoni, G. (2021). A meta-analysis on heart rate variability biofeedback and depressive symptoms. Scientific Reports, 11(1), 6650. https://doi.org/10.1038/s41598-021-86149-7
Pope, K. J., Lewis, T. W., Fitzgibbon, S. P., Janani, A. S., Grummett, T. S., Williams, P. A. H., Battersby, M., Bastiampillai, T., Whitham, E. M., & Willoughby, J. O. (2022). Managing electromyogram contamination in scalp recordings: An approach identifying reliable beta and gamma EEG features of psychoses or other disorders. Brain and Behavior, 12(9), e2721. https://doi.org/10.1002/brb3.2721
Sadowski, A., Dunlap, C., Lacombe, A., & Hanes, D. (2021). Alterations in Heart Rate Variability Associated With Irritable Bowel Syndrome or Inflammatory Bowel Disease: A Systematic Review and Meta-Analysis. Clinical and Translational Gastroenterology, 12(1), e00275. https://doi.org/10.14309/ctg.0000000000000275
Staudacher, H. M., Black, C. J., Teasdale, S. B., Mikocka-Walus, A., & Keefer, L. (2023). Irritable bowel syndrome and mental health comorbidity—Approach to multidisciplinary management. Nature Reviews Gastroenterology & Hepatology, 20(9), 582–596. https://doi.org/10.1038/s41575-023-00794-z
Thatcher, R. W., Walker, R. A., Biver, C. J., North, D. N., & Curtin, R. (2003). Quantitative EEG normative databases: Validation and clinical correlation. Journal of Neurotherapy, 7(3-4), 87–121. https://doi.org/10.1300/J184v07n03_05
Thatcher, R. W. (2010). Validity and Reliability of Quantitative Electroencephalography. Journal of Neurotherapy, 14(2), 122–152. https://doi.org/10.1080/10874201003773500
Thayer, J. F., Hansen, A. L., Saus-Rose, E., & Johnsen, B. H. (2009). Heart Rate Variability, Prefrontal Neural Function, and Cognitive Performance: The Neurovisceral Integration Perspective on Self-regulation, Adaptation, and Health. Annals of Behavioral Medicine, 37(2), 141–153. https://doi.org/10.1007/s12160-009-9101-z
Tomasi, J., Zai, C. C., Zai, G., Herbert, D., Richter, M. A., Mohiuddin, A. G., Tiwari, A. K., & Kennedy, J. L. (2024). Investigating the association of anxiety disorders with heart rate variability measured using a wearable device. Journal of Affective Disorders, 351, 569–578. https://doi.org/10.1016/j.jad.2024.01.137
Vezenkov, S. R. (2016). COMPLEX PROGRAM FOR PREVENTION OF OCCUPATIONAL DEPRIVATION IN PERSONS WITH Irritable Bowel Syndrome (IBS) КОМПЛЕКСНА ПРОГРАМА ЗА ПРЕВЕНЦИЯ НА ДЕЙНОСТНИ ОГРАНИЧЕНИЯ ПРИ ЛИЦА СЪС СИНДРОМ НА РАЗДРАЗНЕНО ЧЕРВО. https://doi.org/10.13140/RG.2.2.10009.75365
Vezenkov, S. R., & Mitev, S. O. (2015). A modified brief biofeedback protocol improves the quality of life in a female patient with severe irritable bowel syndrome: A case report. https://doi.org/10.13140/RG.2.1.1159.1767
Wang, H., Mou, S., Pei, X., Zhang, X., Shen, S., Zhang, J., Shen, X., & Shen, Z. (2025). The power spectrum and functional connectivity characteristics of resting-state EEG in patients with generalized anxiety disorder. Scientific Reports, 15(1), 5991. https://doi.org/10.1038/s41598-025-90362-z
Wang, J., Fang, J., Xu, Y., Zhong, H., Li, J., Li, H., & Li, G. (2022). Difference analysis of multidimensional electroencephalogram characteristics between young and old patients with generalized anxiety disorder. Frontiers in Human Neuroscience, 16, 1074587. https://doi.org/10.3389/fnhum.2022.1074587
Whitham, E. M., Pope, K. J., Fitzgibbon, S. P., Lewis, T., Clark, C. R., Loveless, S., Broberg, M., Wallace, A., DeLosAngeles, D., Lillie, P., Hardy, A., Fronsko, R., Pulbrook, A., & Willoughby, J. O. (2007). Scalp electrical recording during paralysis: Quantitative evidence that EEG frequencies above 20Hz are contaminated by EMG. Clinical Neurophysiology, 118(8), 1877–1888. https://doi.org/10.1016/j.clinph.2007.04.027