

Violeta R. Manolova and Stoyan R. Vezenkov
Center for applied neuroscience Vezenkov, BG-1583 Sofia, e-mail: info@vezenkov.com
For citation: Manolova, V.R. and Vezenkov, S.R. (2025) A qEEG-Derived Screen Reactivity Index Quantifies Pre–Post Changes After a 40-Day Digital Detox Despite Persistent Screen Addiction: Single-Case Evidence With Concurrent HRV. Nootism 1(6), 13-30, https://doi.org/10.64441/nootism.1.6.2
Abstract
Screen addiction in youth has been linked to sleep disturbance, autonomic dysregulation, and impaired self-regulation, yet objective markers that quantify screen-specific neurophysiological reactivity beyond resting measures remain limited. This article reports a pre–post case study of a 13-year-old boy with early‑onset screen‑addictive behavior who underwent assessment before and after a 40-day mountain expedition combined with substantial reduction of digital stimulation. Quantitative EEG (qEEG) ratio topographies were acquired under Eyes Closed (EC), Eyes Open (EO), and Video Watching (VW) conditions and expressed as z-scores relative to normative references, supplemented by percent-change state contrasts. Heart rate variability (HRV) was analyzed separately for the three conditions using time-, frequency-, and nonlinear-domain metrics and composite indices of parasympathetic and sympathetic activity. Parent interviews documented screen-use regulation, withdrawal-like reactions to interruption, sleep/autonomic symptoms, somatic complaints, and behavioral/academic functioning. A Screen Reactivity Index was proposed as scalp-resolved percent modulation of EEG ratio indices from Eyes Open baseline to Video Watching. Pre-intervention qEEG deviations were predominantly state-dependent and most evident during video viewing, whereas post-intervention ratio maps were generally closer to normative ranges across all conditions, accompanied by attenuated extremes in Eyes Closed–to–Eyes Open reactivity and an altered Eyes Open–to–Video Watching modulation pattern captured by the Screen Reactivity Index. Crucially, the study identified a biphasic shift in Screen Reactivity: the pre-intervention "Burnout Response" (where screen stimulation activated a fatigued, high-theta brain) inverted to a post-intervention "Trance Response" (where screen exposure induced immediate prefrontal slowing/dissociation in a sensitized brain). HRV showed a marked shift toward parasympathetic predominance across all conditions, with decreased heart rate and increased vagally mediated variability (e.g., RMSSD increased from 46.6 to 64.6 ms in Eyes Open, from 53.6 to 83.8 ms in Eyes Closed, and from 37.1 to 64.1 ms during Video Watching), alongside improved composite autonomic indices. Parents reported improved sleep quality and resolution of multiple autonomic and somatic complaints, while tolerance to screen restriction and internalized behavioral control did not improve; oppositional reactivity to device removal intensified and attentional/academic difficulties persisted. These findings suggest that while nature-based digital detox effectively resets autonomic and cortical regulation, it acts as a physiological prerequisite rather than a standalone cure. Sustainable recovery and effective clinical treatment of screen addiction necessitate a paradigm shift beyond mere neurophysiological restoration. While re-establishing autonomic and cortical homeostasis is a critical prerequisite, it must be integrated with a comprehensive modification of the underlying psychosocial architecture. Specifically, long-term remission requires targeting family dynamics to resolve maladaptive relational patterns, extinguishing cue-dependent behaviors, transitioning from ineffective external restrictions to internalized self-regulation, and fundamentally restructuring lifestyle habits to foster healthy, non-digital coping mechanisms. The proposed Screen Reactivity Index offers a structured approach for quantifying cortical response to screen stimuli and warrants validation in cohorts using standardized stimuli, band-power decomposition, and behavioral outcome measures.
Keywords: screen detox; Nature Therapy; Wilderness Expedition; adolescent; screen addiction; video watching; qEEG; EEG ratio indices; state reactivity; screen reactivity index; heart rate variability (HRV); Biopsychosocial homeostasis
Introduction
Screen addiction use is a growing social issue sparking worldwide debate. Internet Addiction Disorder (IAD) has been shown to disrupt daily life by causing neurological complications, psychological disturbances, and social impairments (Cash et al., 2012). Consequently, the potential inclusion of IAD in future iterations of the Diagnostic and Statistical Manual of Mental Disorders (DSM) remains a critical topic of discussion (Nemeroff, C.B. et al., 2022)
The digital environment – particularly video content – can amplify physiological activation and alter attentional and arousal mechanisms. In contrast, prolonged exposure to natural environments, combined with physical exertion and restricted screen exposure, is frequently associated with enhanced autonomic regulation and recovery. Therefore, this study utilizes Heart Rate Variability (HRV) and Quantitative EEG (qEEG) as complementary biomarkers to assess autonomic balance and cortical dynamics under conditions of rest and screen stimulation.
Numerous studies link excessive digital media use and screen addiction to elevated stress, disrupted sleep, and dysregulated heart rate variability (HRV). As a result, "digital detox" has been identified as a key research priority alongside the development of complex therapeutic interventions (Elkin et al., 2025; Manolova & Vezenkov, 2025b; Reid Chassiakos et al., 2016; S. R. Vezenkov & Manolova, 2025b)
In research literature, digital detox is typically defined as a voluntary, intentional timeout from electronic devices or specific applications. Most studies have focused on general or student populations rather than clinically diagnosed cases of internet addiction or gaming disorder. Interventions often involve time-limited abstinence (e.g., stopping social media for days) or fixed-cap reductions. While results regarding effectiveness are mixed, consistent findings suggest that reducing smartphone or social media use leads to a decline in depressive symptoms (Radtke et al., 2022)
For example, limiting social media use to 30 minutes daily for two weeks resulted in improvements in sleep quality, stress, and perceived wellness, though objective physical health outcomes showed no statistical change (Coyne & Woodruff, 2023). Similarly, reducing smartphone screen time to ≤2 hours per day for three weeks among healthy students yielded small-to-moderate improvements in depressive symptoms, stress, and general well-being (Pieh et al., 2025)
Direct evidence regarding HRV changes during digital detox remains sparse and heterogeneous. A recent secondary analysis of a screen-time reduction trial (<2 h/day) reported that HRV (Fitbit-derived RMSSD) actually declined during the intervention relative to baseline. The authors interpreted this as a potential withdrawal-like response during behavioral change (Dale et al., 2025). In contrast, a separate two-week detox study reported improved HRV alongside reduced pulse rate and systolic blood pressure, particularly when the detox was combined with alternative activities such as mindfulness and exercise (Farrukh et al., 2025)
Taken together, these reports suggest that autonomic responses during screen reduction may differ based on: (i) whether the measurement captures an early "withdrawal/adaptation" phase versus a later stabilization phase; and (ii) whether the reduction is paired with structured replacement activities that target stress physiology (Dale et al., 2025)
Because many detox programs implicitly increase nature exposure and alter daily routines, the nature-therapy literature offers relevant context. Systematic reviews of "forest bathing" consistently report increases in parasympathetic activity (lnHF) and decreases in sympathovagal balance indices. (McEwan et al., 2021; Wen et al., 2019) Even short-term forest immersion (2 days) has been shown to increase HRV while reducing salivary cortisol and electrodermal activity (Queirolo et al., 2024)
Furthermore, the recovery process is deeply embedded in the family system. Within family dynamics, unconscious elements in the inter-parental relationship can exert a direct influence on the child's emotional and physiological states (Petrov et al., 2025)
Study Aim
The present case study aims to assess the effects of a prolonged digital detox during a 40-day mountain expedition on an adolescent with screen addiction, accompanied by his parents. It evaluates the impact on behavior, emotional self-regulation, functional changes in the autonomic nervous system and cerebral cortex, and the core symptoms of addiction.
Study Design
A pre-post study design was implemented surrounding a 40-day mountain expedition combined with a digital detox. The pre-intervention assessment was conducted one week prior to departure, while the post-intervention assessment took place one week after returning from the expedition. The evaluation comprised three key components: (1) A semi-structured clinical interview; (2) Multimodal assessment of peripheral autonomic nervous system (ANS) activity; (3) Quantitative electroencephalography (qEEG).
Methods
Ethical Considerations and Informed Consent
All study procedures were conducted in strict adherence to the ethical standards of the institutional research committee and with the 1964 Declaration of Helsinki and its later amendments or comparable ethical standards. Given the participant’s age (13 years), a dual-consent process was implemented. Written informed consent was obtained from the subject’s legal guardians (parents) regarding the study design, data collection methods (HRV and qEEG), and the publication of the clinical data. Concurrently, the study procedures were explained to the minor in age-appropriate language, and his voluntary verbal and written assent was obtained prior to both the pre- and post-intervention assessments. The participant and his guardians were informed of their right to withdraw from the study at any time without consequence.
To protect the participant's privacy, all personal identifiers, including name, specific dates of birth, and precise residential location, have been anonymized. The clinical data and topographic maps presented in this report have been de-identified to ensure confidentiality. Explicit written consent was provided by the parents for the publication of this case report and any accompanying images or neurophysiological data.
Semi-structured interview
A standardized parent questionnaire (2022 version, developed at the Vezenkov Center for Applied Neuroscience, Sofia) was used, covering: Age of first screen exposure; Daily screen time and type of screen activities; Reactions to screen time restriction; Sleep (bedtime, duration, nocturnal symptoms); Somatic, vegetative, and behavioral manifestations; Parental assessment of screen dependency.
The questionnaire data were analyzed descriptively and used as clinical context for the interpretation of the objective measurements (presented separately).
Screen detox during a 40-day mountain expedition
The intervention undertaken by the parents to improve the child's condition consisted of a prolonged mountain expedition (40 days). The screen detox was not total; it included screen device usage for 15 minutes, 3 times per week. This involved complete detachment from civilization, with multi-hour treks several days a week and 1–2 rest days per week at a tent camp, with only two 2-day stays in a mountain hut. Both parents and the child participated in the expedition.
Video Watching Stimulation Protocol
To evaluate neurophysiological reactivity to digital stimuli, a standardized "Video Watching" (VW) condition was implemented immediately following the resting-state recordings. The stimulation protocol consisted of a 5-minute block of continuous video exposure. The stimulus was presented on an 80-inch television display with screen brightness standardized at 50%, viewed from a fixed distance of approximately 150 cm.
The video content was specifically selected to replicate the subject’s problematic usage patterns, consisting of material chosen by the subject. To ensure direct comparability between the pre- and post-intervention assessments, the identical stimulus sequence was used for both recording sessions. Audio was enabled and set to a consistent, standardized volume level. This protocol was designed to provoke a "Screen Reactivity" response by mimicking the specific visual-spatial and pacing dynamics of the subject's typical screen engagement.
Assessment of Autonomic Balance
Peripheral autonomic nervous system signals were recorded using the GP8 Amp 8-channel biofeedback amplifier and Alive Pioneer Plus software (Somatic Vision Inc., USA). The parameters assessed included: Heart Rate (HR); Heart Rate Variability (HRV); Peripheral Skin Temperature; Respiratory Rate; Skin Conductance Level (SCL); Surface Electromyography (EMG); HRV indices – such as SDNN (standard deviation of normal-to-normal intervals), total power, LF/HF ratio, stress index, sympathetic nervous system (SNS) index, and parasympathetic nervous system (PNS) index – were first analyzed in Alive Pioneer Plus and then exported for further processing in Kubios HRV Scientific Lite software (University of Eastern Finland).
Quantitative EEG (qEEG) Assessment
Electroencephalographic recordings were conducted using a 19-channel monopolar montage with the Neuron-Spectrum-4P system and Neuron-Spectrum.NET software (Neurosoft LLC, Russia). EEG was acquired at sampling rate of 5000 Hz with hardware band‑pass filter 0,1-100 Hz. Impedances were kept < 5 kΩ. Data were recorded with the left mastoid (A1) as the online reference and were offline re-referenced to linked ears (A1–A2) to match the NeuroGuide normative reference. Artifact handling used manual inspection and EMG channel checks. Eyes‑closed/open epochs were at least 60 × 3 s, artifact‑free. Z‑scores were computed against the NeuroGuide lifespan database age‑adjusted norms (Thatcher, 2010; Thatcher et al., 2003).
Quantitative parameter measurements taken before and after the screen detox expedition were compared against a normative neuro-database rather than directly against each other. To mitigate variability associated with electrode application and measurement procedures, and to ensure internal normalization, the study evaluated spectral reactivity. Specifically, this analysis quantified the percentage difference in frequency band power ratios between Eyes-Open (EO) and Eyes-Closed (EC) states.
Specifically, the percentage difference in spectral power ratios between Eyes-Open and Eyes-Closed states (spectral reactivity) was calculated for the following indices: Theta/Alpha, Theta/Beta (12–25 Hz), Theta/Beta1 (12–15 Hz), Theta/Beta2 (15–18 Hz), Theta/High Beta (25–30 Hz), and Alpha/Beta. Additionally, screen reactivity was assessed by calculating the percentage difference in spectral power ratios between the Eyes-Open (resting) and Video Watching conditions. These differential values were compared between the pre- and post-expedition assessments, as well as against age- and gender-matched normative data.
Results
Case Description
Screen Exposure History A 13-year-old boy began using screen devices at 3–4 years of age and screen-based games at age 4–5. For several months, the child’s screen time has been restricted to 2.5 hours daily, irrespective of weekdays, weekends, or holidays. Primary screen activities include short-form videos (social platforms), social media, online communication, video games (including shooting games and Minecraft), and video content creation.
Regulation and Tolerance Attempts to restrict screen time have yielded only short-term effects. The child voluntarily tolerates a maximum of 1–2 hours without screen access. However, under external (parental) restriction, he can abstain for up to a week. This discrepancy suggests a reliance on external regulation rather than internalized behavioral control.
Behavioral Reactions Interruption of screen activity precipitates multiple negative reactions, including refusal, ignoring requests, procrastination, verbal opposition, and angry outbursts. These behaviors are consistent with models of dependency and deficits in inhibitory control.
Sleep and Autonomic Symptoms Bedtime is delayed (23:30–00:30), with an average sleep duration of approximately 9 hours. Periodic parasomnias and symptoms of dysregulation are noted, including somniloquy (sleep talking), somnambulism (sleepwalking), snoring, and mouth breathing. Autonomic manifestations, such as cold extremities and hyperhidrosis (sweating), as well as tics and involuntary movements, are also present.
Psychosomatic and Behavioral Manifestations Parents report periodic gastrointestinal complaints, headaches, and musculoskeletal pain. Between ages 9 and 12, symptoms of impulsivity, irritability, hyperactivity, aggression, and attention deficits emerged, accompanied by impaired concentration and a decline in academic motivation and performance.
Parental Assessment Parents characterize the child as screen-dependent but do not identify themselves as having similar dependency issues.
Post-Expedition Follow-up A follow-up parent interview was conducted following the 40-day mountain expedition. Screen exposure remains regulated at 2.5 hours per day, with no observed improvement in tolerance or self-regulation regarding device usage. Negative reactions to device removal and restriction have increased in intensity.
However, significant improvements were observed in sleep quality, alongside the resolution of most autonomic dysregulations, specifically cold extremities, sweating, and somatic complaints (abdominal, cephalic, and muscular pain). Emotional and behavioral issues – including irritability, impulsivity, aggression, oppositional behavior, impaired concentration, and low academic motivation – persist at pre-intervention levels. Some behaviors, particularly reactivity toward the father, have worsened. The father assesses the intervention as successful for the parents, though it yielded no visible improvement in the child's overall behavior.
Heart Rate Variability (HRV) Analysis
HRV profiles are presented separately for Eyes Open (EO), Eyes Closed (EC), and Video Watching (VW) conditions, both before and after the intervention.
The aggregated changes in the SNS Index, PNS Index, RMSSD, and LF/HF ratio are displayed comparatively across the three conditions, with a direct pre/post contrast.
Figures 1, 2, and 3 present the HRV analysis results for the EO, EC, and VW states, respectively, comparing pre-intervention (Panel A) and post-intervention (Panel B) data. Comparative panels against normative values for the parasympathetic (PNS Index) and sympathetic (SNS Index) branches are included. The analysis encompasses:
- Time-domain parameters: Mean RR, Mean HR, SDNN, RMSSD, NN50, pNN50, Stress Index;
- Frequency-domain parameters: VLF, LF, HF power, LF/HF ratio, Total Power;
- Nonlinear parameters: SD1, SD2, SD2/SD1, Approximate Entropy, Sample Entropy, DFA ɑ1 and ɑ
An RR histogram, spectral analysis, and Poincaré plot are presented for each measurement.
1. Eyes Open (EO) Condition
Before the prolonged screen detox in the open-eyes condition, the parasympathetic nervous system (PNS) index was −0.4463, the sympathetic nervous system (SNS) index was 0.9572, and the stress index was 11.2809. The mean RR interval was 769.48 ms, corresponding to a mean heart rate of 77.97 beats per minute (bpm). The RMSSD value was 46.62 ms, the NN50 count was 134, and pNN50 was 27.97%. The RR triangular index was 10.43 and TINN was 196 ms. In the frequency domain, peak frequencies were observed at 0.033 Hz in the VLF band, approximately 0.09–0.11 Hz in the LF band, and 0.17–0.31 Hz in the HF band. Total power ranged between 869.33 and 1484.99 ms², and the LF/HF ratio ranged from 1.57 to 4.35 depending on the spectral method. Nonlinear analysis showed SD1 of 33.00 ms, SD2 of 44.32 ms, an SD2/SD1 ratio of 1.34, approximate entropy of 1.308, sample entropy of 2.0086, DFA $\alpha$1 of 0.9979, and DFA $\alpha$2 of 0.3132.
After the screen detox in the open-eyes condition, the PNS index was 0.4646, the SNS index was −0.2438, and the stress index was 7.1236. The mean RR interval was 877.12 ms and the mean heart rate was 68.41 bpm. RMSSD was 64.57 ms, NN50 was 212, and pNN50 was 46.80%. The RR triangular index was 15.13 and TINN was 283 ms. Peak frequencies were observed at 0.033 Hz in the VLF band, approximately 0.075–0.10 Hz in the LF band, and 0.15–0.28 Hz in the HF band. Total power ranged from 3096.91 to 3416.78 ms², and the LF/HF ratio ranged from 1.95 to 3.50. Nonlinear measures showed SD1 of 45.71 ms, SD2 of 73.42 ms, an SD2/SD1 ratio of 1.61, approximate entropy of 1.3339, sample entropy of 2.2095, DFA ɑ1 of 1.0993, and DFA ɑ2 of 0.3019.
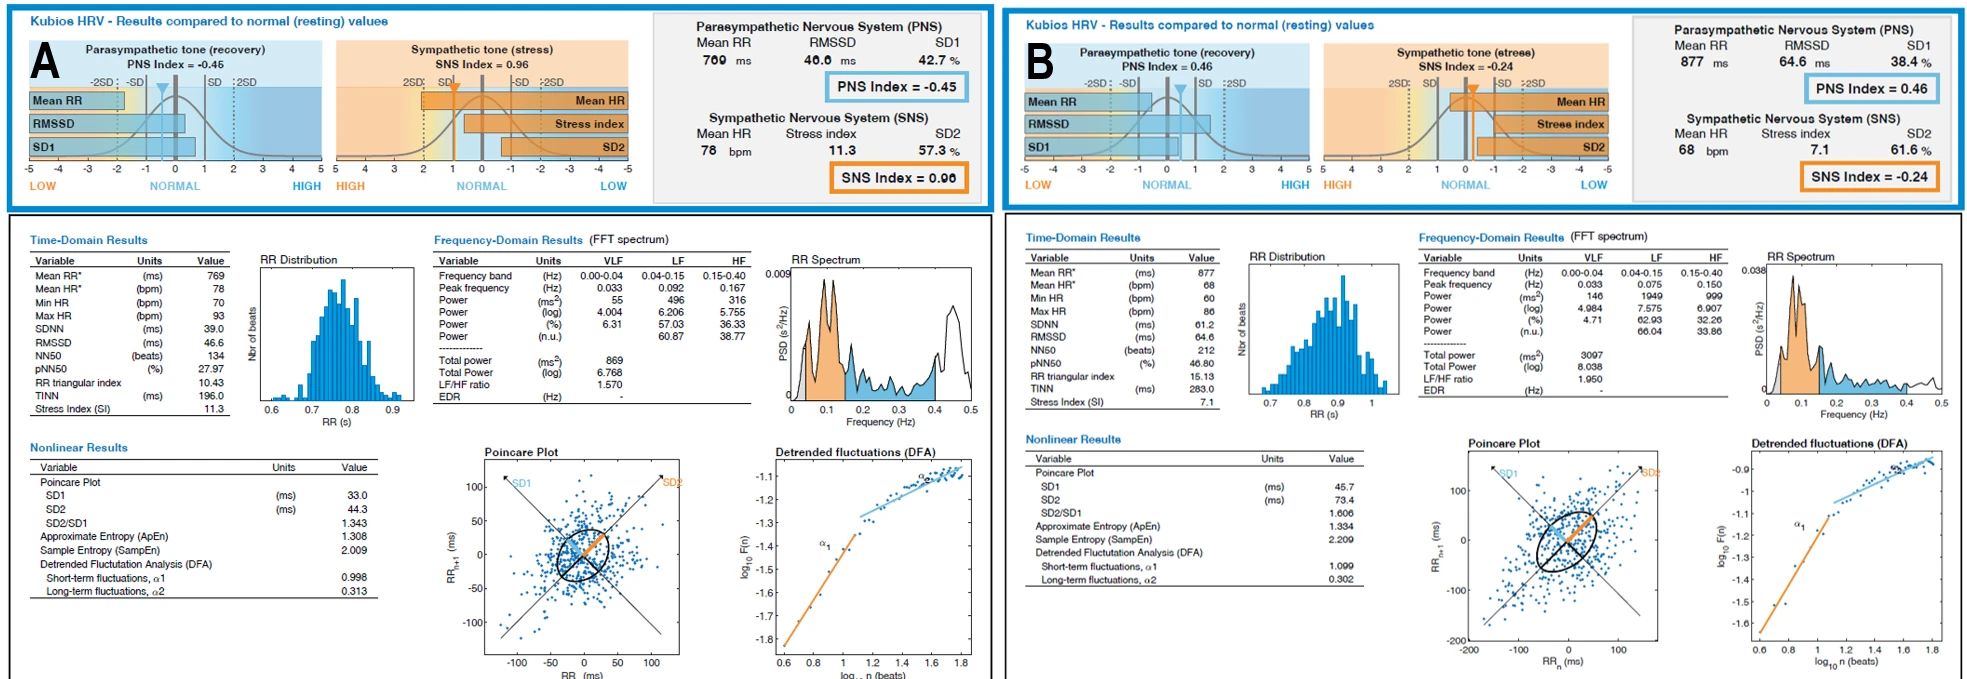
Figure 1-1. HRV Profile (Eyes Open) Before and After a 40-Day Mountain Expedition Combined with Digital Detox. (A) HRV Profile – Before (Eyes Open); (B) HRV Profile – After (Eyes Open).
2. Eyes Closed (EC) Condition
Before the prolonged screen detox in the eyes-closed condition, the PNS index was −0.0469, the SNS index was 0.7096, and the stress index was 11.3374. The mean RR interval was 794.08 ms and the mean heart rate was 75.56 bpm. RMSSD was 53.58 ms, NN50 was 149, and pNN50 was 43.95%. The RR triangular index was 10.97 and TINN was 186 ms. Peak frequencies were 0.033 Hz in the VLF band, approximately 0.08–0.11 Hz in the LF band, and 0.32–0.40 Hz in the HF band. Total power ranged from 681.55 to 1384.00 ms², and the LF/HF ratio ranged from 1.03 to 1.38. Nonlinear analysis showed SD1 of 37.94 ms, SD2 of 36.44 ms, an SD2/SD1 ratio of 0.96, approximate entropy of 1.1257, sample entropy of 1.8226, DFA α1 of 0.6334, and DFA α2 of 0.305.
After the prolonged screen detox in the eyes-closed condition, the PNS index was 1.6015, the SNS index was −0.7902, and the stress index was 7.6168. The mean RR interval was 968.05 ms and the mean heart rate was 61.98 bpm. RMSSD was 83.83 ms, NN50 was 358, and pNN50 was 66.67%. The RR triangular index was 16.30 and TINN was 255 ms. Peak frequencies were 0.033 Hz in the VLF band, approximately 0.10–0.13 Hz in the LF band, and approximately 0.36 Hz in the HF band. Total power ranged from 2407.49 to 2646.29 ms², and the LF/HF ratio ranged from 0.21 to 0.34. Nonlinear analysis showed SD1 of 59.34 ms, SD2 of 46.81 ms, an SD2/SD1 ratio of 0.79, approximate entropy of 1.3158, sample entropy of 1.8882, DFA α1 of 0.4438, and DFA α2 of 0.1799.
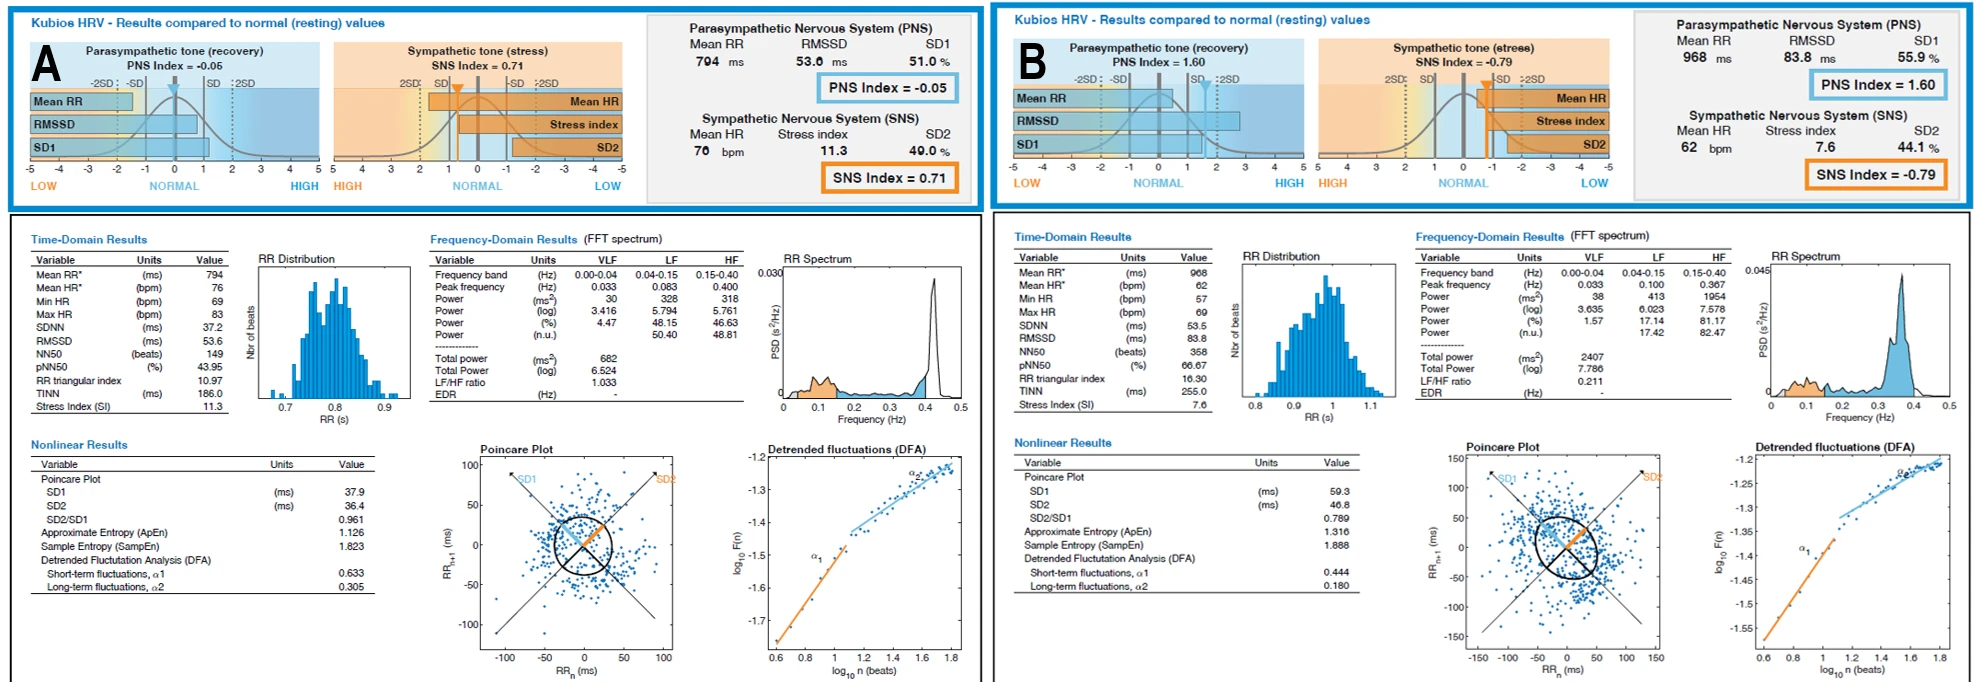
Figure 1-2. HRV Profile (Eyes Closed) Before and After a 40-Day Mountain Expedition Combined with Digital Detox. (A) HRV Profile – Before (Eyes Closed); (B) HRV Profile – After (Eyes Closed).
3. Video Watching Condition
Before the prolonged screen detox in the VW condition, the PNS index was −1.072, the SNS index was 1.3967, and the stress index was 10.8127. The mean RR interval was 712.11 ms and the mean heart rate was 84.26 bpm. RMSSD was 37.09 ms, NN50 was 132, and pNN50 was 14.70%. The RR triangular index was 10.58 and TINN was 208 ms. Peak frequencies were identified at 0.025 Hz in the VLF band, approximately 0.09–0.10 Hz in the LF band, and 0.16–0.27 Hz in the HF band. Total power ranged from 1326.04 to 1594.88 ms², while the LF/HF ratio ranged from 2.46 to 5.86. Nonlinear measures showed SD1 of 26.24 ms, SD2 of 51.42 ms, an SD2/SD1 ratio of 1.96, approximate entropy of 1.5329, sample entropy of 1.8946, DFA α1 of 1.2183, and DFA α2 of 0.3825.
After the prolonged screen detox in the VW condition, the PNS index was 0.4675, the SNS index was −0.3604, and the stress index was 6.4977. The mean RR interval was 883.95 ms and the mean heart rate was 67.88 bpm. RMSSD was 64.06 ms, NN50 was 249, and pNN50 was 42.28%. The RR triangular index was 17.35 and TINN was 322 ms. Peak frequencies were observed at 0.033 Hz in the VLF band, approximately 0.09 Hz in the LF band, and 0.15–0.25 Hz in the HF band. Total power ranged from 3190.63 to 3579.77 ms², and the LF/HF ratio ranged from 1.45 to 3.63. Nonlinear measures showed SD1 of 45.34 ms, SD2 of 76.37 ms, an SD2/SD1 ratio of 1.68, approximate entropy of 1.4432, sample entropy of 2.015, DFA α1 of 1.0226, and DFA α2 of 0.5026.
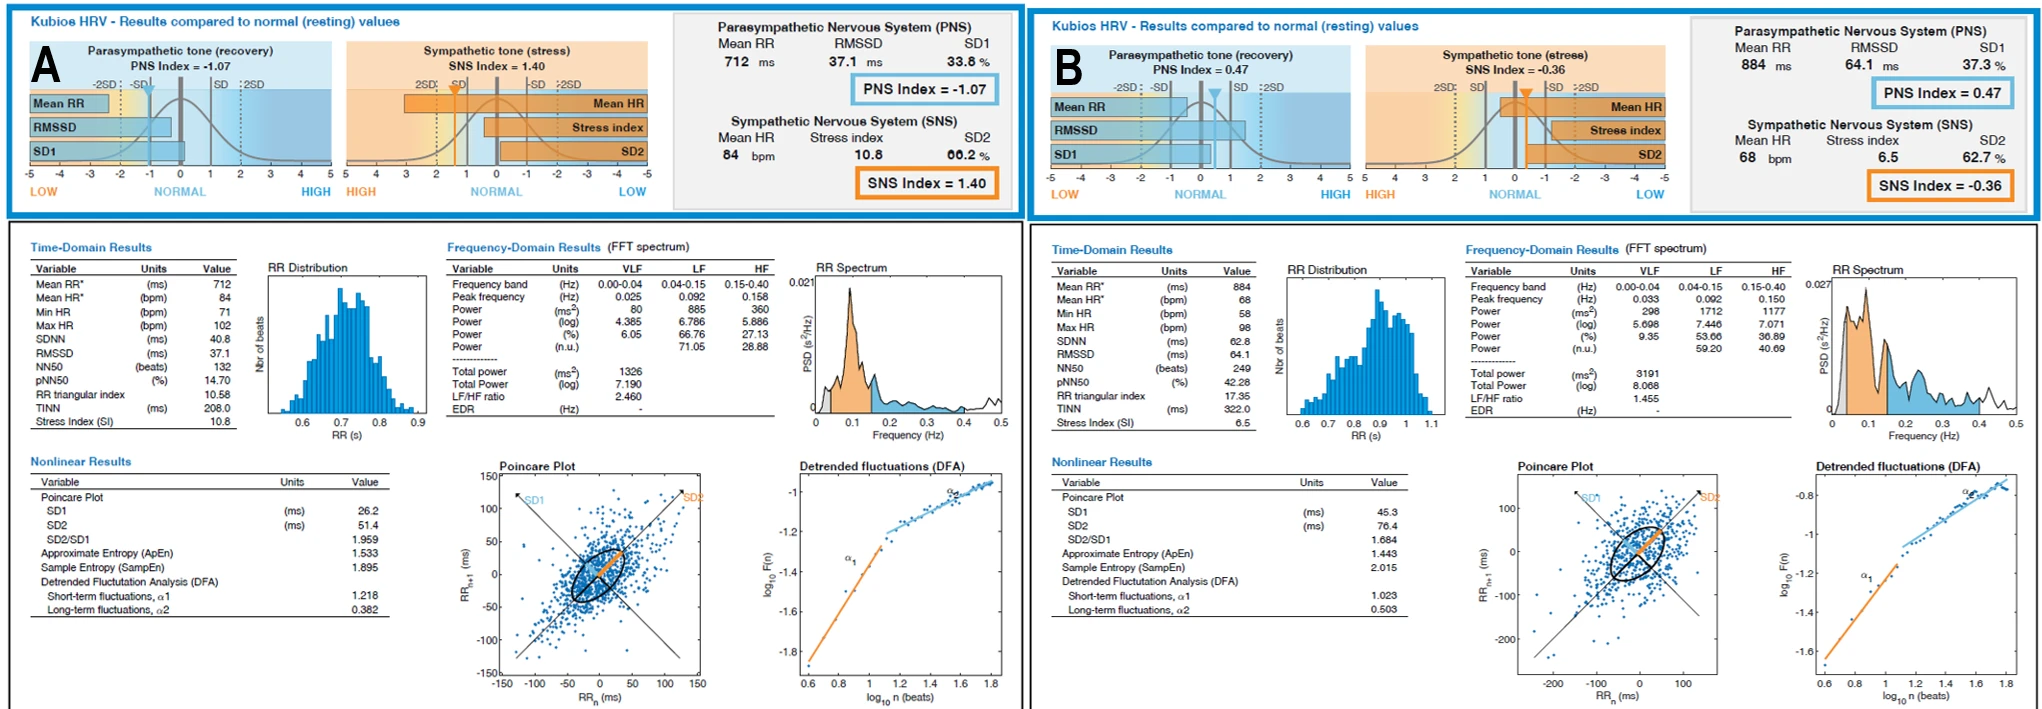
Figure 1-3. HRV Profile (Video Watching) Before and After a 40-Day Mountain Expedition Combined with Digital Detox. (A) HRV Profile – Before (Video Watching); (B) HRV Profile – After (Video Watching).
Figure 1–4 displays bar plots representing four key autonomic regulation measures – SNS Index, PNS Index, RMSSD, and LF/HF ratio – across three conditions: EO, EC, and VW. Comparisons are made between baseline values and those obtained after the prolonged screen detox.
Before the prolonged screen detox, the SNS Index indicated elevated sympathetic tone with values of 0.96 (EO), 0.71 (EC), and 1.40 (VW). After the detox, a marked reduction in sympathetic dominance was observed across all conditions, with values dropping to negative ranges: −0.24 (EO), −0.79 (EC), and −0.36 (VW).
Conversely, the PNS Index showed a substantial shift from negative to positive values, indicating restored vagal tone. Pre-detox values were −0.45 (EO), −0.05 (EC), and −1.07 (VW). Post-detox assessments revealed significant increases to 0.46 (EO), 1.60 (EC), and 0.47 (VW).
RMSSD, a primary marker of vagally mediated HRV, increased consistently across all conditions. Pre-detox values were 46.6 ms (EO), 53.6 ms (EC), and 37.1 ms (VW). Following the detox, values improved to 64.6 ms (EO), 83.8 ms (EC), and 64.1 ms (VW), reflecting enhanced parasympathetic activity.
The LF/HF ratio showed condition-dependent changes. In the Eyes Closed condition, the ratio decreased significantly from 1.03 to 0.21, and in the VW condition, it dropped from 2.46 to 1.45, suggesting a shift toward parasympathetic dominance. In the Eyes Open condition, a slight increase was observed from 1.57 to 1.95.
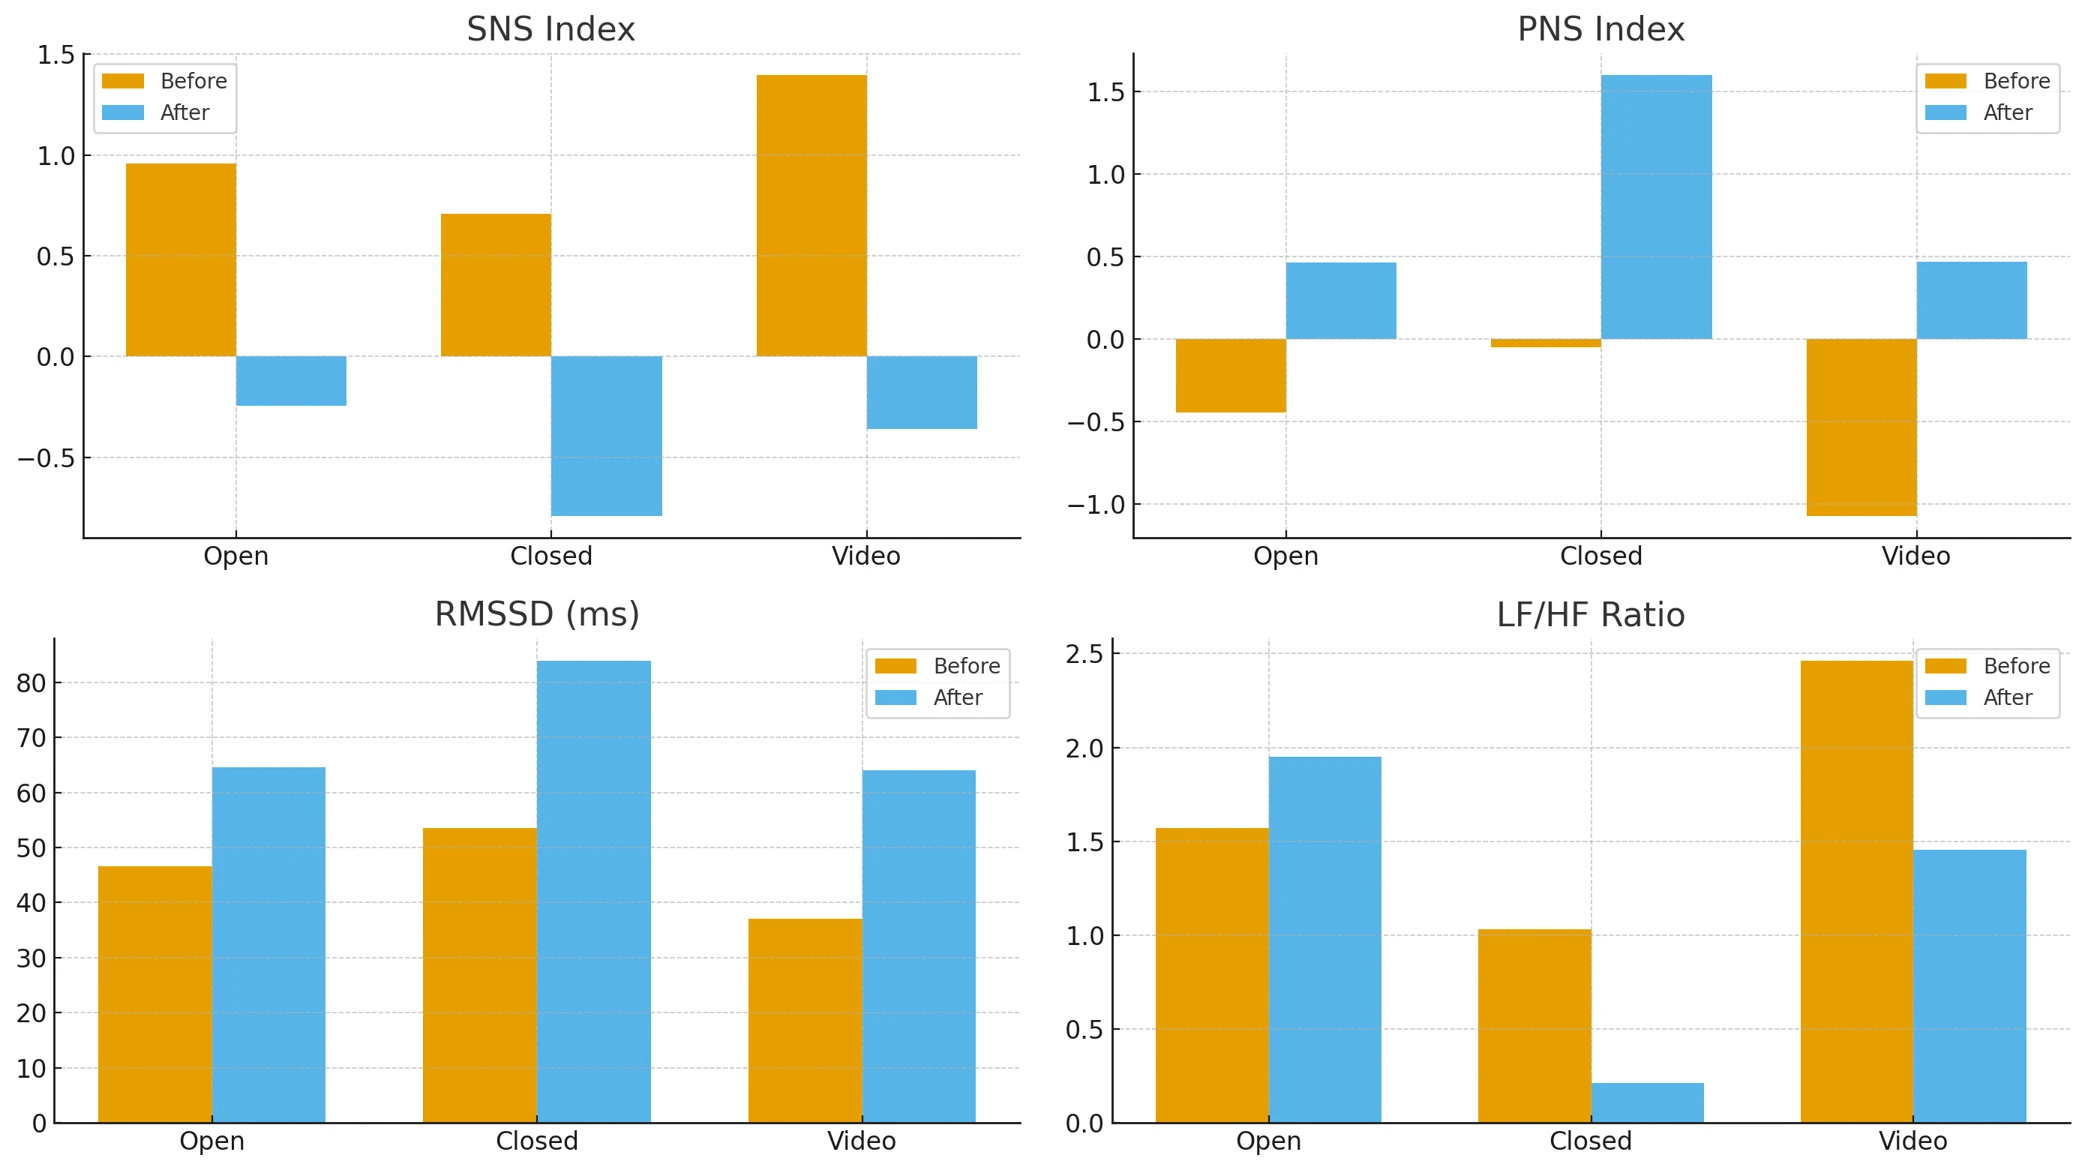
Figure 1-4. Changes in Key HRV Parameters Before and After a 40-Day Mountain Expedition Combined with Digital Detox. SNS Index, PNS Index, RMSSD, and LF/HF Ratio are shown for the three conditions (Eyes Open, Eyes Closed, and Video Watching), comparing Before vs. After the expedition.
qEEG analysis
Short description of chosen indices
Theta/Alpha Ratio (The "Drowsiness" Index) This ratio compares the brain’s drifting, dream-like state (Theta) against its relaxed, idling state (Alpha). It is often used as a marker for drowsiness or cortical under-arousal. High values typically indicate "brain fog," metabolic fatigue, or difficulty maintaining a clear, alert state, while low values may suggest hyper-vigilance.
Theta/Beta Ratio (The "Attention" Index) Comparing slow-wave drifting (Theta) against active cognitive processing (Beta), this ratio is a primary FDA-approved marker for ADHD. Elevated values indicate inattention, distractibility, and difficulty sustaining focus, while very low values can signal anxiety or over-focused rigidity. (Stefanova et al., 2025)
Theta/High Beta Ratio (Emotional Regulation) This index balances slow-wave dissociation (Theta) against high-frequency stress processing (High Beta). High values can suggest emotional checking-out or dissociation, while low values point to intense rumination or anxiety.
Alpha/Beta Ratio (Processing Efficiency) This measures the balance between relaxation and active thinking. High scores indicate a brain "locked" in idle mode, struggling to engage in tasks, whereas low scores indicate an inability to relax or a brain that is constantly "on."
Alpha/High Beta Ratio (Somatic Anxiety) This is a key marker for physical tension. Low values (negative Z-scores) indicate that "stress" activity (High Beta) is dominating "relaxation" (Alpha), often manifesting as somatic anxiety or body tension.
Beta/High Beta Ratio (Cognitive Efficiency) This ratio reflects the "quality" of processing. It compares efficient cognitive work (Beta) against wasteful, stressful processing (High Beta). Low values suggest the brain is "spinning its wheels"—working hard but inefficiently.
Significant differences (>±2 Z scores) of the indices before the detox were observed only by video watching (VW):
- A significant focal deviation of theta/alpha index was observed at T5 (Left Posterior Temporal) with a Z-score of +2.04
- Alpha/Beta index showed the most widespread dysregulation during VW. Significant suppression (negative Z-scores exceeding -2) was found across multiple sites:
- F7 (Left Inferior Frontal): −2.48
- F3 (Left Frontal): −2.06
- T5 (Left Temporal): −2.05
- T6 (Right Posterior Temporal): −2.49
- P4 (Right Parietal): −2.05.
- Alpha/High Beta index showed significant suppression (deep blue regions) in the temporal and parietal lobes.
While the majority of the cortex maintained average arousal levels, the left temporal region—associated with auditory and linguistic processing—exhibited significant slowing. This suggests that during screen stimulation, this specific processing node was effectively "checking out," functioning in a drowsy, hypo-active state rather than actively engaging with the content.
The screen stimulus triggered a global suppression of the Alpha/Beta ratio. This indicates that the brain was unable to access a relaxed, receptive state (Alpha) and was instead locked into high-frequency activation (Beta). This pattern reflects a rigid, stressed neural response to the digital medium rather than flexible cognitive engagement.
The extremely low values of the Alpha/High Beta index demonstrate that screen reactivity involved a high degree of physiological tension. This finding suggests that the visual and auditory cortices were not merely active, but hyper-irritated, operating in a frequency range associated with anxiety and an inability to settle.
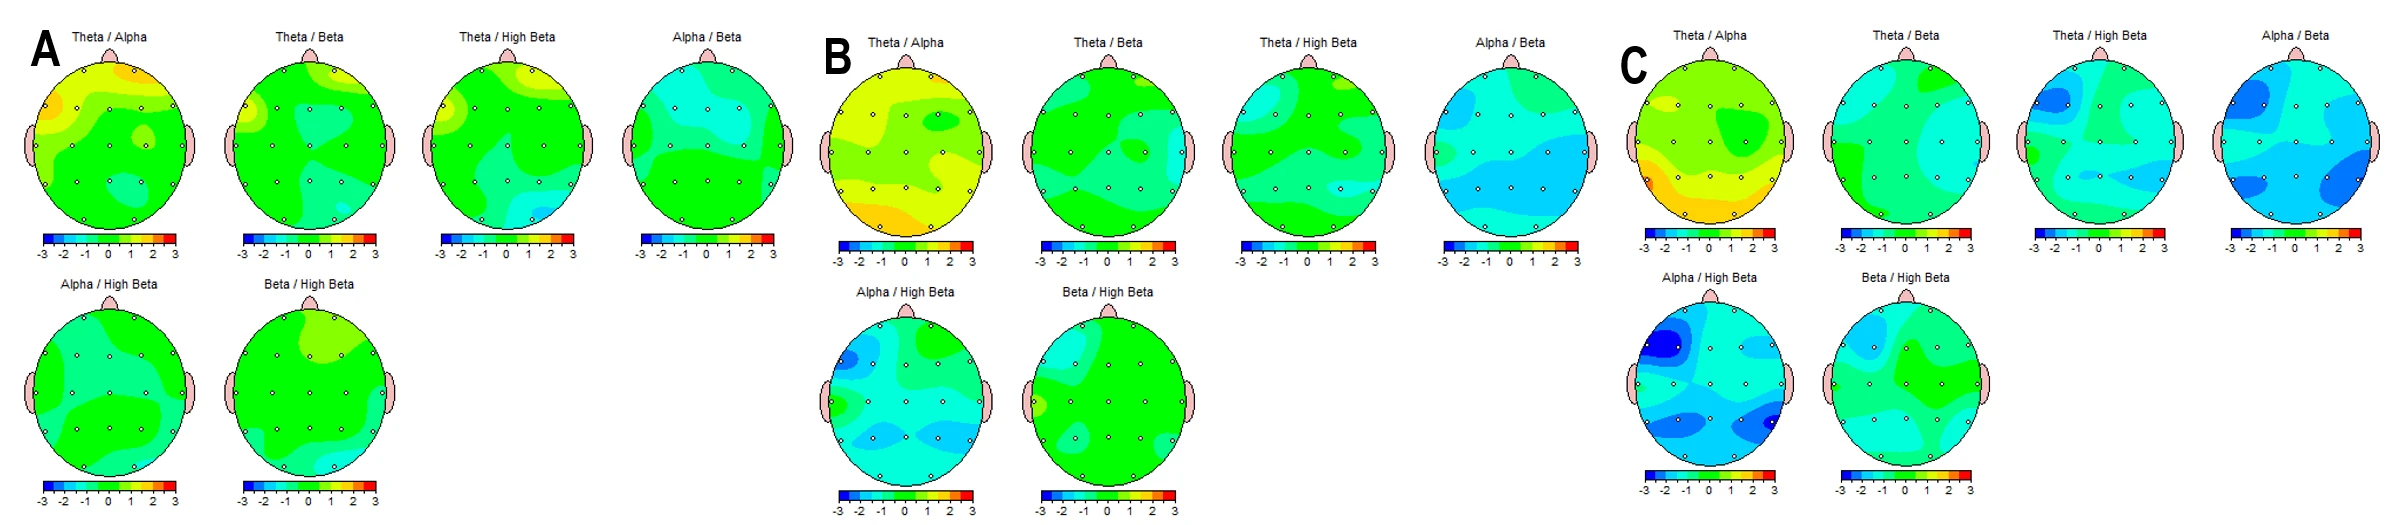
Figure 2-1. EEG Topographic Maps of Frequency-Band Ratios Before a 40-Day Mountain Expedition Combined with Digital Detox. (A) Eyes Closed; (B) Eyes Open; (C) Video Watching. Pre-intervention z-score topographic distributions (−3 to +3) for multiple EEG frequency-band ratios, including Theta/Alpha, Theta/Beta, Theta/High Beta, Alpha/Beta, Alpha/High Beta, and Beta/High Beta. Each scalp map illustrates spatial patterns of relative power ratio deviations across recording sites under the three behavioral conditions before the expedition.
Following the prolonged screen detox, all spectral indices across all conditions returned to normative ranges, including during the VW state (Figure 2-2).
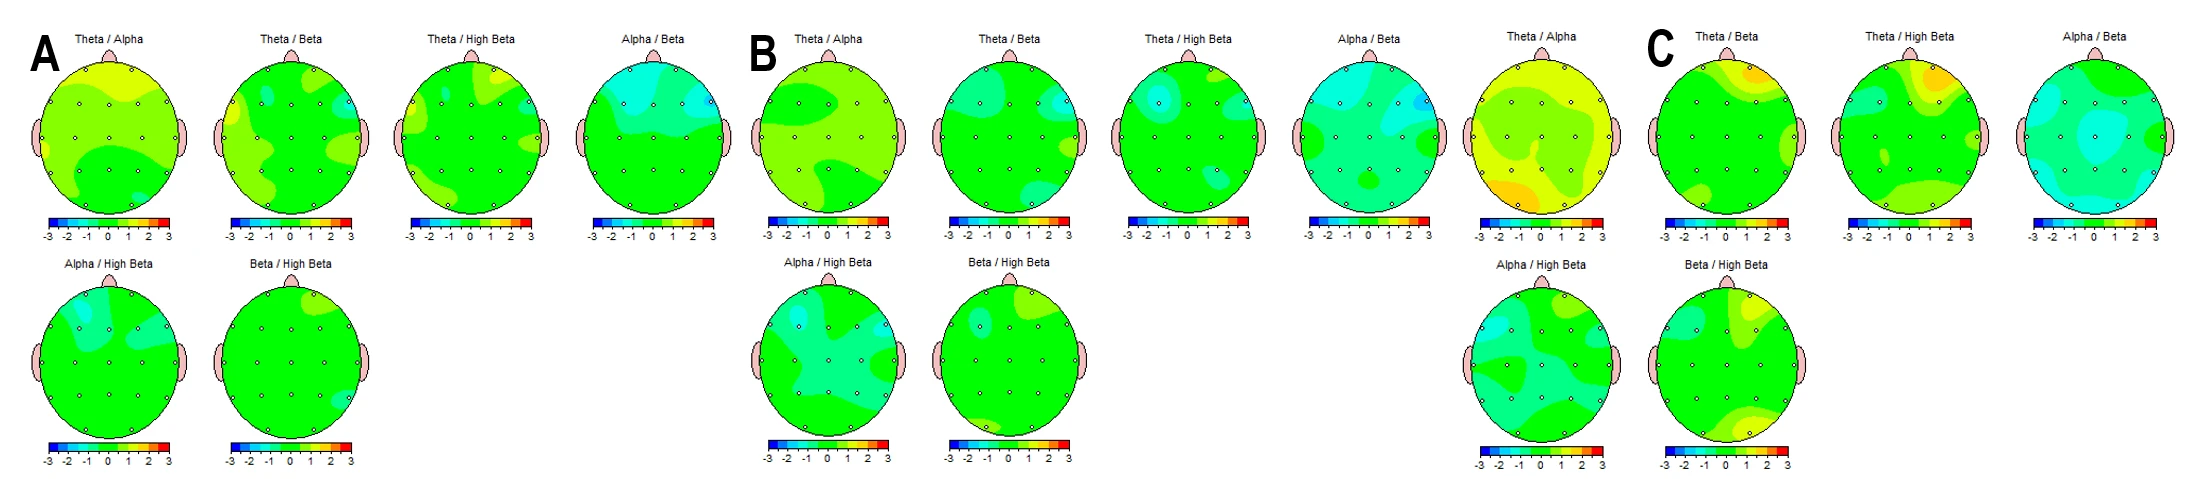
Figure 2-2. EEG Topographic Maps of Frequency-Band Ratios After a 40-Day Mountain Expedition Combined with Digital Detox. (A) Eyes Closed; (B) Eyes Open; (C) Video Watching. Post-intervention z-score topographic distributions (−3 to +3) for multiple EEG frequency-band ratios, including Theta/Alpha, Theta/Beta, Theta/High Beta, Alpha/Beta, Alpha/High Beta, and Beta/High Beta.
Figure 2-3 illustrates the percentage difference in spectral power ratios between behavioral states, effectively mapping the brain's functional reactivity. The comparison focuses on two key state transitions: the Arousal Response (Eyes Closed → Eyes Open) and the Screen Reactivity Response (Eyes Open → Video Watching).
The Arousal Response Eyes Open vs. Eyes Closed (Panels A vs. B) measures the "Berger effect" – the brain's natural ability to suppress resting alpha rhythms and engage processing networks upon opening the eyes.
Before the detox, opening the eyes resulted in a massive, potentially excessive surge in low-frequency ratios (up to +74% for Theta/Alpha). This suggests a "cortical instability" where opening the eyes did not lead to crisp activation but rather a disorganized surge in slow-wave dominance relative to fast activity. The brain struggled to efficiently transition from a closed-eye resting state to an open-eye alert state.
After the detox, the transition became more regulated. The maximum percentage change for Theta/Alpha dropped from ~74% to ~41%.The reduction in the extreme percentage spikes indicates a more stable and controlled arousal response. The brain became more efficient at maintaining equilibrium when shifting from internal rest (Eyes Closed) to external vigilance (Eyes Open).
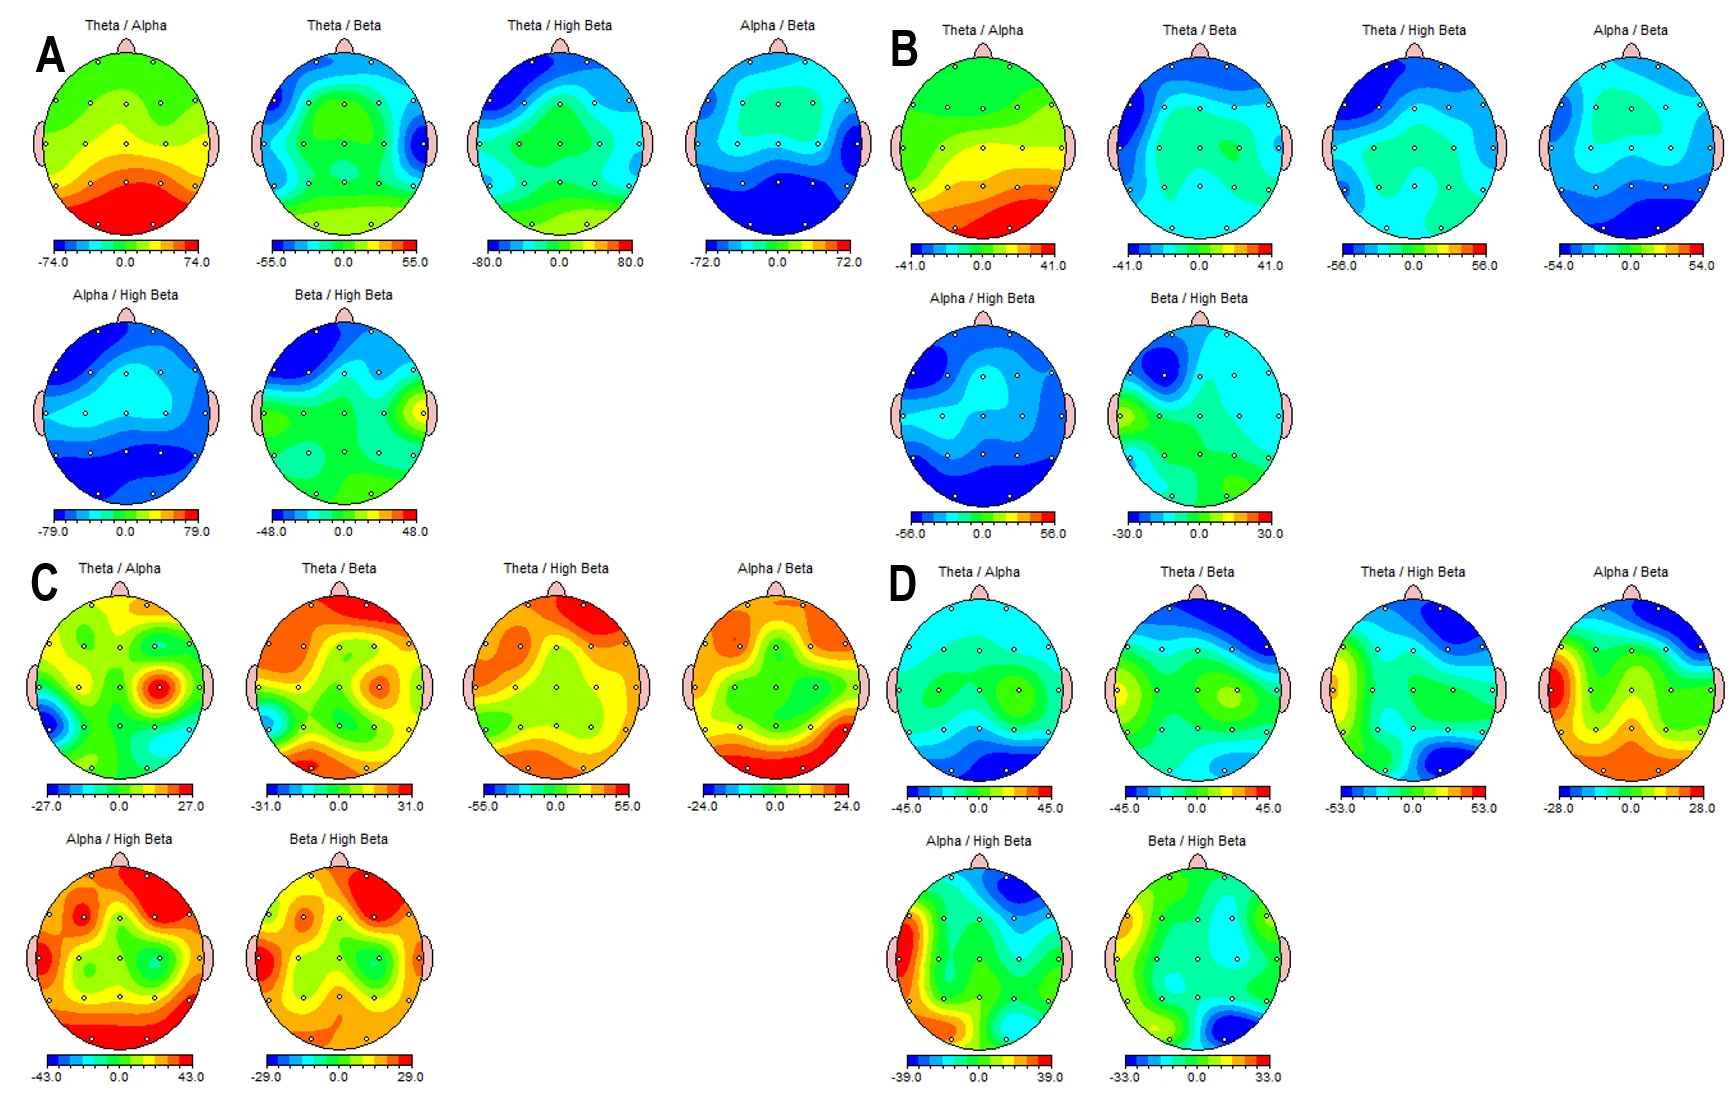
Figure 2-3. EEG Topographic Difference Maps Expressed as Percent Change Across Conditions. (A) Eyes Open minus Eyes Closed (%), Before the 40-day mountain expedition and digital detox. (B) Eyes Open minus Eyes Closed (%), After the expedition. (C) Eyes Open minus Video Watching (%), Before the expedition. (D) Eyes Open minus Video Watching (%), After the expedition. Each scalp map displays percent difference values for EEG frequency-band ratios (Theta/Alpha, Theta/Beta (12-25 Hz), Theta/Beta1 (12-15 Hz), Theta/Beta2 (15-18 Hz), Theta/High Beta (25-30), and Alpha/Beta), illustrating condition-dependent modulation patterns before and after the intervention.
The results showed two distinct hypothesized patterns of screen reactivity.
- Possible Chronic Screen Addiction Pattern (Pre-Detox, Panel C)
The pre-intervention maps display dominant positive values (warm colors) across frontal and central regions. Positive values indicate that indices like Theta/Alpha were significantly higher at rest than during VW (EO > VW). This reflects a chronic "hyper-stimulation/withdrawal" cycle. The resting brain is exhausted, operating in a high-theta "drowsy" or "foggy" state. When the screen stimulus is introduced, this fog collapses, and the brain shifts into a relative state of activation. The screen acts as a necessary crutch to bring the brain out of its baseline under-arousal.
- Possible Early-Stage/Vulnerability Pattern (Post-Detox, Panel D)
Following the 40-day detox, the maps shift to a blue/cool spectrum in the prefrontal cortex. Blue values indicate a negative difference (EO < VW), meaning the spectral ratios increased during VW compared to rest. This response—where the prefrontal cortex "slows down" (increased Theta/Alpha) immediately upon screen exposure—is characteristic of the very early stages of screen addiction or a "clean" brain encountering a super-stimulus. The detox successfully "reset" the brain, clearing the chronic exhaustion fog. However, this "clean" state renders the brain more vulnerable to the immediate hypnotic effect of the screen. The prefrontal cortex, no longer calloused by chronic over-use, reacts to the video stimulus by instantly down-regulating executive control (slowing down), mimicking the initial "trance" state that hooks new users. This highlights that while the chronic symptoms were resolved, the underlying susceptibility to the stimulus remains and is potentially heightened due to the reset sensitivity. (Table 1)
Table 1. Two possible stages of screen addiction
|
Condition |
Map Color (Fig 2-3) |
Mathematical Meaning |
Physiological State |
Clinical Stage |
|
Pre-Detox |
Red / Warm |
EO > VW |
Resting "Fog" clears upon stimulation. |
Chronic/Late Stage: Burnout & Addiction |
|
Post-Detox |
Blue / Cool |
EO < VW |
Alert brain "slows down" upon stimulation. |
Early Stage/Reset: High Sensitivity & Trance Susceptibility |
The negative deviation in the occipital theta/alpha index (Figure 2-4) indicates that upon opening the eyes, the subject's visual cortex exhibits a lower-than-normal Theta/Alpha ratio. This signifies visual hyper-arousal: the visual processing centers fail to maintain a healthy baseline of relaxed alertness and instead shift immediately into a state of heightened physiological tension and vigilance.
In contrast to the theta maps, the alpha/beta map (bottom right) shows yellow regions. Positive colors indicate that the subject’s alpha/beta ratio difference (EO-EC) was higher than the norm. Normally, when eyes open, Alpha drops sharply while Beta increases to process information, causing the alpha/beta ratio to decrease. A higher-than-norm value here suggests that this healthy suppression of Alpha relative to Beta failed to occur efficiently. While the visual cortex (posterior) was hyper-aroused (low $\theta/\alpha$), the broader cognitive cortex maintained too much Alpha relative to Beta. This reflects a "disengaged" or "foggy" processing state: the eyes are open and visually vigilant (hyper-seeing), but the cognitive brain is not fully engaging in active processing (hypo-thinking).
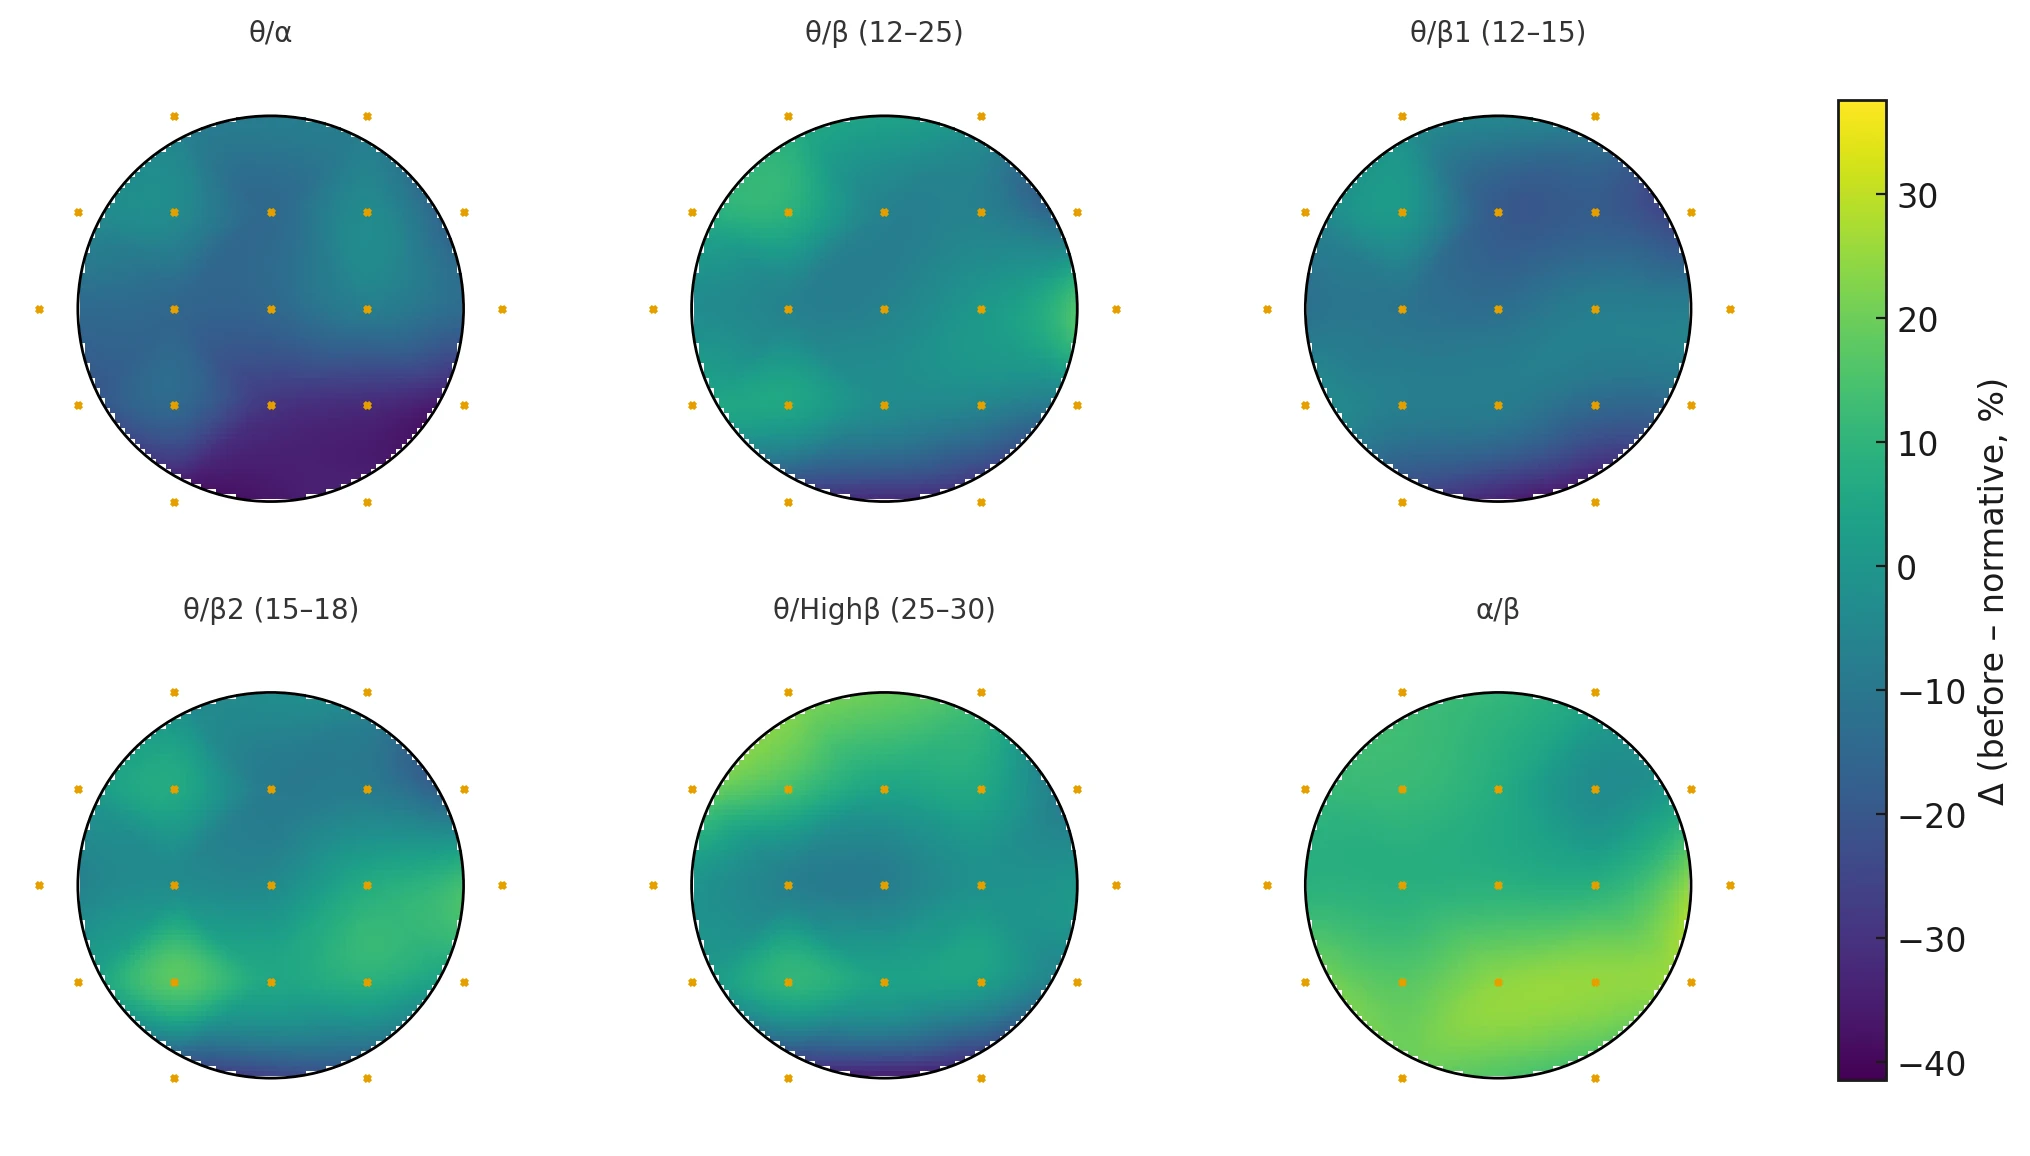
Figure 2-4. Six-Panel Scalp Heatmap of BEFORE–Normative Differences (EO–EC Contrast) Across EEG Ratio Indices. Topographic maps display percent deviation from normative reference values for the contrast Eyes Open minus Eyes Closed (EO–EC) before the 40-day mountain expedition and digital detox. The six indices shown are:
θ/α, θ/β (12–25 Hz), θ/β1 (12–15 Hz), θ/β2 (15–18 Hz), θ/Highβ (25–30 Hz), and α/β.
Warmer colors represent higher EO–EC ratio values relative to the normative database, and cooler colors represent lower values.
Figure 2-5 illustrates the percentage deviation of the subject’s "Berger Effect" (Eyes Open minus Eyes Closed) from normative values after the 40-day detox. The results indicate a complex, non-linear recovery where different brain regions adopted distinct compensatory strategies. The theta/alpha map shows bright yellow/light green coloration in the posterior (occipital/parietal) regions. The subject’s theta/alpha ratio change (EO-EC) is significantly higher than the norm. A high theta/alpha ratio is the classic marker for drowsiness. This result suggests that upon opening the eyes, the subject's posterior sensory cortex did not fully "sharpen" into a high-frequency beta state as expected. Instead, it maintained a "drowsy" or "hypo-active" buffer, effectively dampening sensory input. This may be a protective mechanism developed during the detox to prevent sensory overload after 40 days of reduced stimulation.
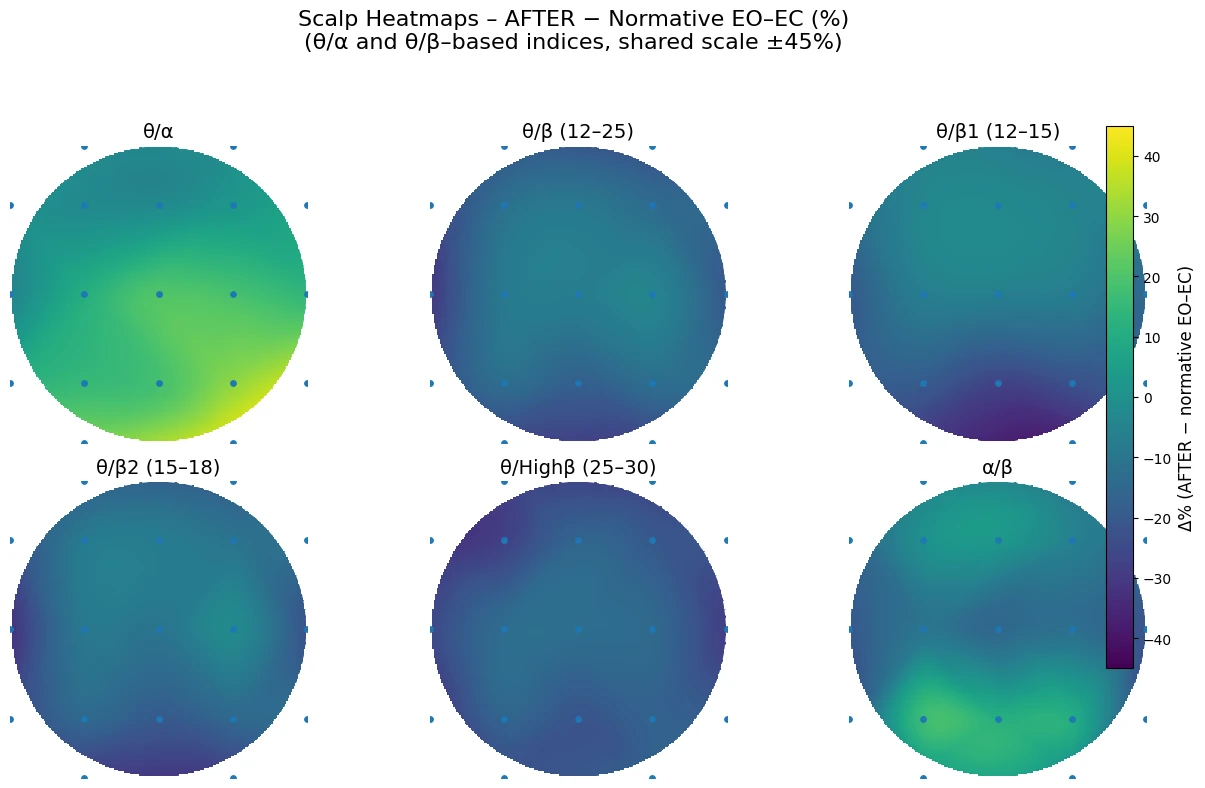
Figure 2-5. Six-Panel Scalp Heatmap of AFTER–Normative Differences (EO–EC Contrast) Across EEG Ratio Indices. Topographic maps display percent deviation from normative reference values for the contrast Eyes Open minus Eyes Closed (EO–EC) after the 40-day mountain expedition and digital detox. The six indices shown are:
θ/α, θ/β (12–25 Hz), θ/β1 (12–15 Hz), θ/β2 (15–18 Hz), θ/Highβ (25–30 Hz), and α/β.
Warmer colors represent higher EO–EC ratio values relative to the normative database, and cooler colors represent lower values.
Figure 2-6 illustrates the net change in the "Berger Effect" reactivity (Eyes Open minus Eyes Closed) comparing the post-detox state directly to the pre-detox state (Δ = After – Before).
The posterior visual cortex exhibits deep blue coloration across most indices. The exception is the alpha/beta ratio, which shows a different pattern (see below).
Deep blue indicates a significant decrease in these ratios during the EO-EC transition compared to the pre-detox baseline. Since a decrease in Theta/Alpha or Theta/Beta signifies increased activation (less drowsiness), this "Blue Visual Cortex" finding confirms that the visual processing centers are now activating more sharply and efficiently upon opening the eyes. The "foggy," drowsy visual response seen before the detox has been replaced by a crisp, high-frequency engagement.
In contrast to the visual cortex, the right-hemispheric lateral regions (F8, T4, T6) display dark red "hotspots" in the Δ theta/beta and Δ alpha/beta maps, with moderate red in Δ theta/beta2.
Red indicates an increase in these ratios (more slow-wave/alpha dominance relative to beta). This suggests a stabilizing "brake" mechanism in the right hemisphere. While the visual cortex (back of head) activates sharply, the emotional and social processing centers (Right Temporal/Frontal) maintain a more relaxed, alpha-dominant state. This prevents the "visual sharpness" from cascading into "emotional anxiety," effectively decoupling visual alertness from stress.
A specific dark red cluster is visible in the left frontal regions (F7, Fp1) on the Δ theta/High beta map. An increase in the Theta/High Beta ratio here is driven by a reduction in High Beta (the denominator). This indicates a profound reduction in executive anxiety. The left prefrontal cortex – often the seat of rumination and "busy brain" – is significantly quieter and less dominated by stress frequencies after the detox.
The Δ alpha/beta map is almost entirely red across all regions (except F4), reaching a maximum intensity at T6 (Right Posterior Temporal). This is the most comprehensive finding. It signifies that across the entire brain, the Alpha/Beta balance has shifted towards Alpha.
Even when eyes are open and processing visual information (as seen by the sharp visual cortex activation), the background state of the brain retains a higher degree of alpha relaxation than before. This confirms the establishment of a "Relaxed Alertness": the subject is awake and processing (Blue visual cortex), but doing so from a foundation of calm (Red global alpha/beta) rather than the frantic, high-beta stress state observed pre-intervention.
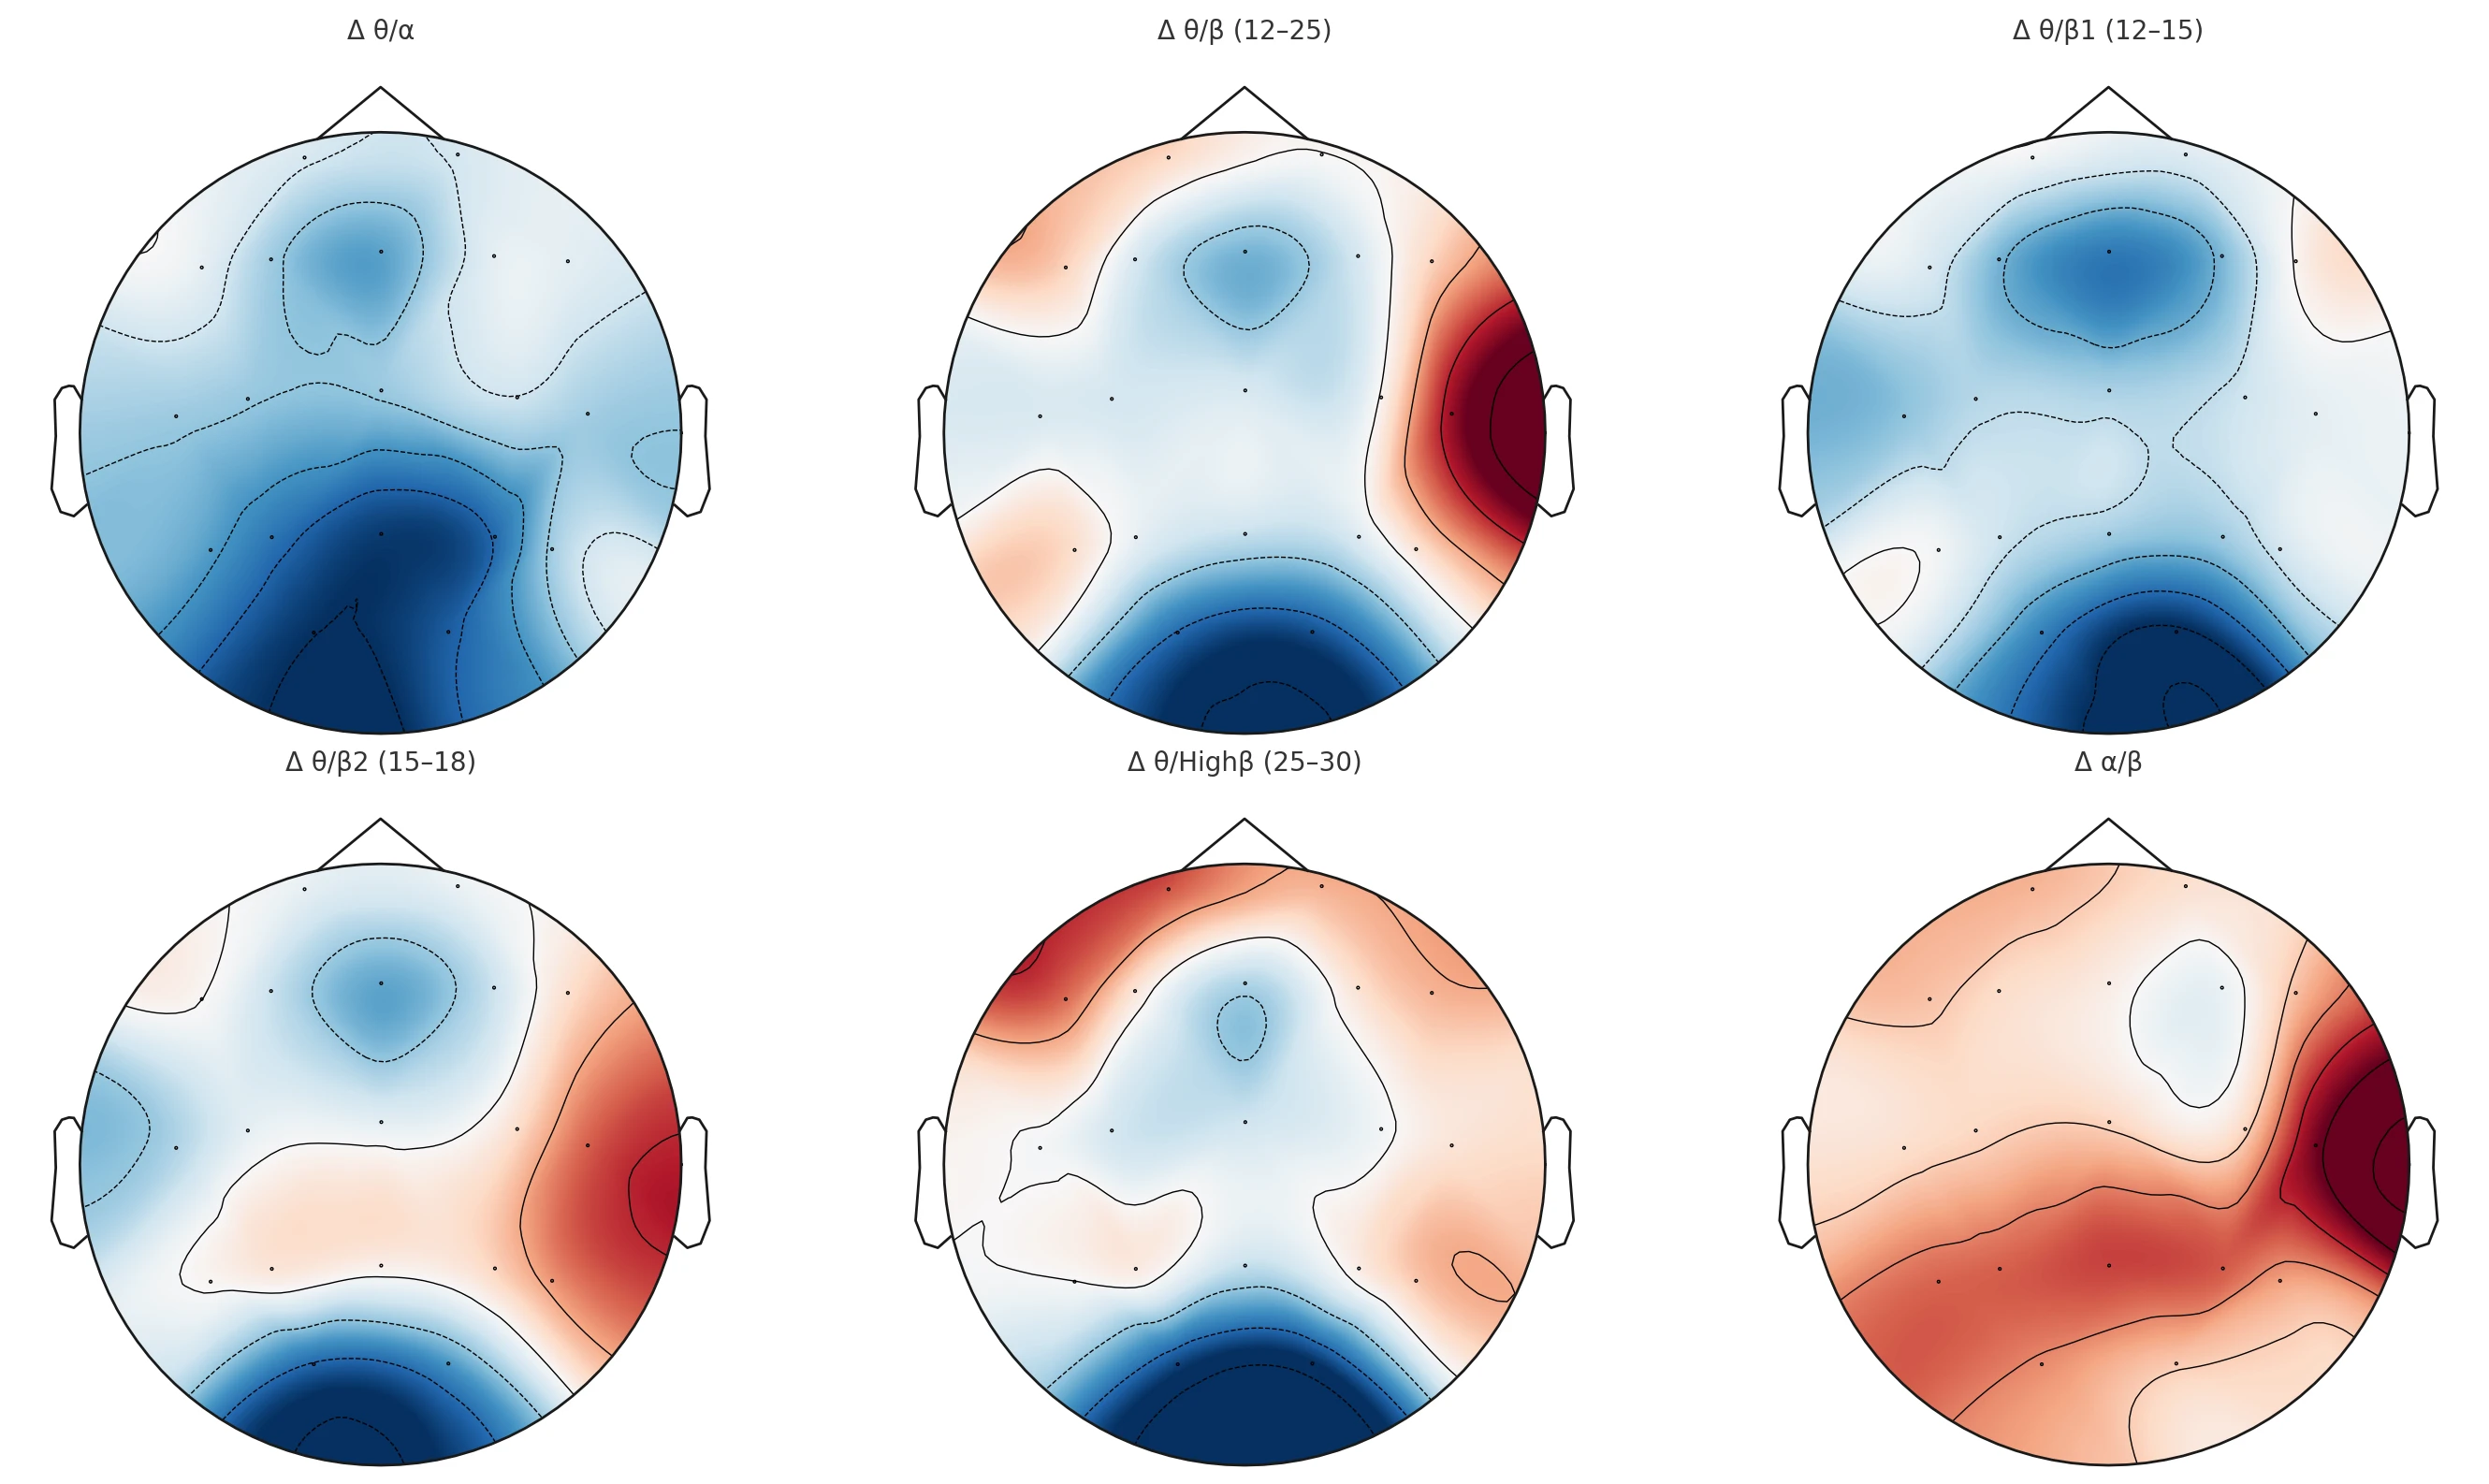
Figure 2-6. Six-Panel EEG Scalp Heatmaps of Δ Frequency-Band Ratios (After – Before) Under the Eyes Open – Eyes Closed Contrast. Topographic maps illustrate post-intervention changes in key EEG ratio indices computed as Δ = (After – Before) for the contrast Eyes Open minus Eyes Closed (EO–EC). The six panels represent: (1) Δ θ/α, (2) Δ θ/β (12–25 Hz), (3) Δ θ/β1 (12–15 Hz), (4) Δ θ/β2 (15–18 Hz), (5) Δ θ/Highβ (25–30 Hz), and (6) Δ α/β. Color gradients depict relative increases (warm colors) and decreases (cool colors) in ratio magnitude across scalp regions, highlighting spatial patterns of neurophysiological modulation following the 40-day mountain expedition and digital detox.
Discussions
Clinical context and interpretation framework
This case involves a 13-year-old boy with very early onset and sustained exposure to screen-based stimulation (initial use at 3–4 years; gaming at 4–5 years), with current primary activities dominated by short-form social video, social media, online communication, and gaming. The behavioral phenotype—limited voluntary tolerance of screen abstinence, reliance on external regulation, and escalation of oppositional/irritable responses when access is interrupted—fits contemporary descriptions of problematic or dependency-like digital use characterized by impaired self-regulation and high cue reactivity. From a physiological standpoint, the pre-intervention history also included delayed bedtime and parasomnia/autonomic features (sleep talking/walking, sweating, cold extremities, tics/involuntary movements, somatic complaints), which provides a relevant baseline for interpreting autonomic and cortical “state regulation” metrics.
A key interpretive point emerging from the follow-up is the dissociation between physiological recovery (sleep quality and most autonomic/somatic dysregulation improved) and behavioral persistence (tolerance/self-regulation did not improve; reactivity to restriction worsened; oppositional and attentional difficulties persisted). This pattern suggests that the intervention was sufficient to shift autonomic tone and neurophysiological state markers, but insufficient to remodel entrenched reinforcement learning, habit loops, or family-system dynamics that maintain screen-seeking behavior.
Autonomic regulation: marked shift toward vagal dominance across states
HRV results showed a large and internally consistent change across Eyes Open (EO), Eyes Closed (EC), and Video Watching (VW) conditions. After the intervention, mean heart rate decreased across conditions (e.g., during VW from ~84 bpm to ~68 bpm), while RMSSD and pNN50 increased substantially (video RMSSD from ~37 ms to ~64 ms; EC RMSSD from ~54 ms to ~84 ms). In parallel, Kubios-derived autonomic indices shifted from sympathetic dominance (positive SNS index, negative PNS index) to a pattern consistent with stronger parasympathetic tone (negative SNS index, positive PNS index) across all three states. Kubios’ PNS/SNS indices are scaled composites intended to summarize autonomic activity relative to normative resting values. Clinically, this autonomic shift aligns with the parental report of improved sleep quality and resolution of several autonomic/somatic complaints (cold extremities, sweating, abdominal/head/muscle pain). It is also consistent with emerging evidence that reducing smartphone use can improve HRV metrics such as RMSSD in controlled designs.
Reduced mobile phone use during digital detox was associated with improved vagal tone and increased HRV, suggesting enhanced parasympathetic regulation. (Thomée et al., 2011)
A controlled reduction in screen exposure (social media, games) for 2–4 weeks showed significant increases in HRV measures (RMSSD, HF power) and reduction in self-reported stress. (Rasmussen et al., 2020)
Excessive screen time is associated with poor sleep and risk factors for cardiovascular diseases such as high blood pressure, obesity, low HDL cholesterol, poor stress regulation (high sympathetic arousal and cortisol dysregulation), and Insulin Resistance. (Lissak, 2018)
Given these comparisons, the most defensible interpretation of your observed changes was that they were compatible with a shift toward higher vagally mediated variability and lower arousal across contexts – especially because RMSSD/SD1 and the Kubios composite indices changed coherently in the same direction. RMSSD in particular was commonly treated as a practical marker of autonomic recovery/stress load when measured consistently. (Hannon et al., 2025)
At the same time, the detox literature indicated that HRV could also transiently decline during early reduction phases (potentially reflecting craving/sleep disruption), so a discussion could acknowledge that timing, compliance burden, and the presence of replacement activities likely influenced whether HRV increased or decreased post-intervention. (Dale et al., 2025)
Our results clearly indicate that the 40-day mountain expedition, combined with a prolonged digital detox, induced significant shifts in autonomic functioning. Specifically, the intervention led to a marked reduction in sympathetic tone and physiological stress indices, alongside a concurrent increase in parasympathetic activity, effectively restoring sympathovagal balance. Crucially, the intervention also fundamentally altered the reactivity of the autonomic nervous system (ANS) to screen stimulation. These findings corroborate established literature regarding the restorative effects of nature exposure and screen abstinence.
However, the data highlights a critical distinction: improved autonomic balance appears to serve only as a physiological prerequisite for subsequent therapeutic work, rather than a standalone cure. Consistent with previous research questioning the long-term efficacy of simple abstinence, the detox alone did not ameliorate the core symptoms of the addiction. In the present case, the psychological components of the addiction remained intact; notably, the subject’s aggressive reactivity toward the father not only persisted but became more pronounced during this period. This suggests that while physiological regulation was achieved, the underlying behavioral and relational dynamics require targeted, intensive neuro- and psychotherapy beyond the scope of digital restriction.
Detox-style restriction can plausibly reduce arousal load (e.g., less cue exposure, less multitasking, fewer sleep disruptions), but the empirical literature shows heterogeneous outcomes, including null effects for simple abstinence (especially for social media breaks). (Lemahieu et al., 2025)
This pre–post qEEG case dataset suggests that a 40-day mountain expedition combined with marked reduction of digital media exposure was associated with two convergent changes in ratio-based scalp topographies. First, the most conspicuous pre-intervention deviations occurred during VW, where z-score maps showed focal left posterior-temporal abnormalities (e.g., T5 θ/α elevation) and widespread suppression of relaxation-to-activation balances (notably α/β and α/Highβ) across fronto-temporo-parietal regions. Second, post-intervention maps were visually closer to the normative range across all three behavioral states (EC, EO, VW), including the previously abnormal video condition (Fig. 2-2).
Resting-state electroencephalography (EEG) shows marked spectral and topographic differences between eyes-closed (EC) and eyes-open (EO) conditions, reflecting changes in cortical activation and arousal states across multiple frequency bands. Studies have demonstrated significant reductions in delta, theta, alpha, and beta power when transitioning from EC to EO, as well as band-specific topographic alterations (e.g., posterior alpha attenuation) that should be considered when selecting baseline conditions for EEG analyses. (Barry et al., 2007)
In parallel, percent-change maps of state transitions (Fig. 2-3) indicated a reduction in extreme EO–EC reactivity (“arousal response”) and a qualitative shift in EO–VW reactivity (“screen response”) from predominantly positive (pre) to more negative frontal expression (post).
These findings align with a plausible “re-normalization” of state regulation: (i) improved stability of the EC→EO transition (reduced overshoot in ratio-based indices), and (ii) altered coupling between resting eyes-open physiology and screen-driven processing demands.
The EO–EC contrast operationalizes a canonical electrophysiological phenomenon: eye opening typically suppresses posterior alpha activity (the “Berger effect”), and the magnitude of this suppression is often treated as a marker of background reactivity to visual input. (Bazanova et al., 2017) Our normative heatmaps (Fig. 2-4 and Fig. 2-5) extend this concept from alpha power alone to a family of ratio indices (θ/α, θ/β variants, θ/Highβ, α/β), thereby characterizing whether the EC→EO transition is dominated by slow-wave relative activity (higher θ-relative ratios) or by faster activity (lower θ-relative ratios), and whether alpha remains disproportionately expressed relative to beta (α/β elevation). The post-intervention reduction in EO–EC percent-change extremes (Fig. 2-3A vs 2-3B) is consistent with a more moderated state shift and may reflect improved regulation of arousal transitions rather than simply “more” or “less” activation.
Importantly, the broader literature emphasizes that alpha reactivity is sensitive to multiple physiological contributors (e.g., vigilance, hormonal state, and EMG contamination), and therefore benefits from standardized acquisition and artifact control when used as an interpretive anchor. (Bazanova et al., 2017) This same caution applies to ratio-based extensions of EO–EC reactivity.
The pre-intervention pattern—deviations emerging predominantly during VW rather than in EC/EO rest—fits a growing literature suggesting that screen exposure and habitual digital engagement can be expressed as altered state-dependent EEG dynamics, not only altered resting baselines. In preschool children, a controlled 6-week screen exposure paradigm was associated with EEG features previously linked to attention difficulties (theta–beta relationships/connectivity), supporting the idea that screen exposure can couple to attention-relevant oscillatory organization. (Zivan et al., 2019)
In clinical and subclinical addiction-related phenotypes (e.g., Internet gaming disorder / problematic internet use), resting-state EEG studies report differences in spectral power—commonly involving beta-band alterations—and associations with symptom severity and impulsivity. (Son et al., 2015)
While those studies are not direct analogs to “video watching reactivity,” they support the broader premise that oscillatory markers in the theta–alpha–beta range track clinically relevant regulation domains (attention, impulsivity, and arousal balance) in populations characterized by dysregulated digital reward engagement.
In addition, task-based EEG studies using emotionally arousing video stimuli show systematic modulation of oscillatory features with arousal level, indicating that “video watching” is not a neutral probe but a controllable stimulus class that can evoke reliable neurophysiological responses. (Kim et al., 2021)
A critical evaluation of the existing literature reveals that neurophysiological evidence for digital detox interventions remains in an early stage. Current research is often limited by heterogeneous definitions of "detox," variable intervention durations, and a lack of standardized physiological endpoints. (Stangl & Riedl, 2024) Against this backdrop, the present dataset provides a distinct and valuable contribution: a high-resolution, topographically resolved qEEG depiction of the pre- and post-intervention states across three distinct behavioral conditions (Eyes Closed, Eyes Open, and Video Watching). Unlike studies relying solely on subjective self-reports or basic autonomic measures, this study captures the specific cortical reorganization associated with prolonged screen abstinence.
The "Screen Reactivity" Index: Definition, Rationale, and Clinical Utility
To better characterize the dynamic neurophysiological shifts associated with screen dependency, this study proposes a novel operational metric termed "Screen Reactivity" (SR). While traditional qEEG analysis often focuses on static states (e.g., absolute power during rest), our findings suggest that the transition between states offers superior diagnostic value.
Operational Definition
We operationalized Screen Reactivity as a within-subject contrast between the resting state (Eyes Open, EO) and active screen engagement (Video Watching, VW). This is expressed as a percentage change relative to the baseline, calculated for any given spectral power ratio (R):
This formula quantifies the magnitude and direction of the cortical shift induced by the screen stimulus. Conceptually, this parallels the standard clinical assessment of Alpha Reactivity (the "Berger effect"), which measures the desynchronization of alpha rhythms upon eye opening as a marker of background sensory responsiveness. The SR index generalizes this reactivity paradigm, replacing the simple sensory input of eye-opening with the complex "super-stimulus" of video consumption as the perturbation state.
The SR index offers three distinct advantages over static qEEG measures:
- Within-Subject Control: By utilizing the EO condition as an immediate baseline, the index partially controls for stable trait factors – such as skull conductivity, anatomical variance, and acquisition parameters. This makes the SR metric more robust against inter-individual variability than single-state absolute values.
- Ecological Validity: VW represents a naturalistic perturbation that mirrors real-world digital engagement far more closely than abstract laboratory vigilance tasks. This ensures the measured reactivity reflects the brain’s actual response to the agent of addiction.
- State-Transition Phenotyping: By embedding established ratios (such as theta/alpha or theta/beta) into a reactivity framework, the SR index yields a state-transition phenotype. It moves beyond characterizing a "resting brain" to quantifying the brain’s dynamic adaptability or rigidity when challenged by a digital stimulus.
The SR index can be contextualized within the broader literature of engagement metrics. In applied psychophysiology and human factors research, engagement has traditionally been operationalized using ratios such as beta/(alpha+theta), a metric originally proposed in NASA-related research for adaptive automation. The SR index advances this concept by framing it as a "reactivity-of-engagement" construct. Rather than measuring the level of engagement per se, SR measures how drastically engagement-linked ratios shift when a screen stimulus is introduced. (Hitt, 1995)
The SR index extends the logic of classic reactivity measures (e.g., EO–EC alpha reactivity) to a perturbation that is directly relevant to the phenotype under investigation—screen engagement. Compared with static resting measures, the SR index emphasizes how the brain transitions from baseline alertness into screen-driven processing. This is theoretically appropriate in screen-use dysregulation, where the clinically salient phenomenon is often cue/stimulus capture, difficulty disengaging, and state inflexibility rather than resting abnormalities alone.
In the present case study, this shift proved critical for staging the addiction. The SR index revealed a transition from a pre-intervention "Burnout Response" (where the screen was necessary to activate a fatigued brain) to a post-intervention "Trance Response" (where the screen induced immediate prefrontal slowing). This suggests that Screen Reactivity may serve as a sensitive, stage-dependent biomarker that is invisible to static resting-state analyses.
Such transitions in functioning have been documented behaviorally in the context of recovery, yet previous research has not demonstrated these shifts as quantifiable qEEG alterations. (Stefanova et al., 2025)
Integrating physiology with the clinical phenotype: why behavior persisted
Despite physiological normalization, the participant’s tolerance and self-regulation around device access did not improve, and oppositional responses intensified. This pattern is clinically plausible for at least four reasons:
- Physiological restoration does not automatically alter reinforcement learning. Autonomic recovery and improved cortical state regulation may reduce somatic distress and improve sleep, yet habitual reward-seeking and cue reactivity can remain stable without targeted behavioral intervention.
- External regulation remained the primary control mechanism. The discrepancy between limited voluntary abstinence and longer abstinence under parental restriction indicates that control was not internalized; continued daily availability (2.5 hours) may maintain cue-driven cycles even if baseline physiology improved.
- Re-entry effects may amplify salience. Returning from a low-stimulation environment can increase the perceived reward value of screens, potentially intensifying frustration and oppositionality when access is restricted.
- Presence of screen trauma – the home environment and the specific visual-spatial stimuli associated with screen device usage serve as triggers that reactivate the dependent behavior.
A significant barrier to behavioral change is the persistence of cue-dependent reactivity, coupled with screen-induced pathological reflexes and synesthesia – constituents of what we define as screen trauma. (Manolova & Vezenkov, 2025a, 2025b; S. Vezenkov & Manolova, 2025a, 2025b; S. R. Vezenkov & Manolova, 2025a) The home environment acts as a landscape of potent conditioned stimuli – where specific visual-spatial configurations (e.g., the gaming setup, lighting, or physical location of device use) trigger immediate associative memories of reward. Upon re-entry into this environment, these contextual cues bypass cognitive control mechanisms and automatically reactivate the neural circuitry of addiction, precipitating a relapse into screen-seeking behavior despite the physiological benefits achieved during the detox.
Previous research indicates that during the initial stages of recovery from early-onset screen addiction treated with complete abstinence, re-exposure to digital screens often precipitates a complete regression and a resurgence of symptomatology (Petrova et al., 2025). Conversely, for older children with severe screen dependency, a strict regimen of total digital detoxification has been demonstrated to lead to full recovery and remission of the addiction (Ivanova et al., 2025).
However, the interpretation of these findings requires a nuanced approach. Given the combined nature of the intervention – which integrated a 40-day mountain expedition with strict screen abstinence –it is difficult to isolate the specific effects of the digital detox from the restorative effects of nature immersion and physical activity. Consequently, the proposed mechanisms, particularly the concept of "Screen Reactivity" and the biphasic model of addiction stages, should be viewed as explicitly hypothesis-generating. While our data offers compelling biomarkers for staging screen dependency, further controlled studies are necessary to validate these indices and disentangle the synergistic components of wilderness therapy and digital abstinence.
These findings are derived from a single-participant, pre–post observational dataset. The mountain expedition includes multiple concurrent exposures (physical activity, sleep, altitude, environmental novelty) that may contribute to EEG changes alongside reduced screen use. Interpretations are therefore hypothesis-generating and should be validated in controlled cohorts with standardized behavioral measures and band-specific power analyses.
Conclusion
This case study indicates that a 40-day mountain expedition combined with a substantial reduction in digital stimulation was associated with a pronounced improvement in physiological regulation, while behavioral self-regulation around screen use remained largely unchanged. Autonomic findings showed a coherent shift toward parasympathetic predominance across Eyes Open, Eyes Closed, and Video Watching conditions, reflected in lower mean heart rate, higher RMSSD and pNN50, and a transition of composite autonomic indices from sympathetic dominance to a more vagally mediated profile. These objective HRV changes converged with caregiver-reported clinical improvements, including better sleep quality and resolution of multiple autonomic and somatic complaints (cold extremities, hyperhidrosis, and recurrent abdominal, head, and musculoskeletal pain), supporting the interpretation of genuine improvement in organism-level recovery capacity.
In parallel, qEEG ratio topographies suggested that pre-intervention dysregulation was primarily state-dependent and most evident during VW, whereas EC and EO conditions were closer to normative ranges. Following the intervention, ratio-based z-score maps across all conditions were generally closer to normative distributions, including during video viewing, implying reduced stimulus-linked cortical dysregulation. Percent-change contrasts further indicated attenuation of extreme Eyes Closed–to–Eyes Open reactivity after the intervention, consistent with improved stability of arousal switching and a more regulated transition from internal rest to externally oriented processing.
A methodological contribution of this work is the proposed Screen Reactivity Index, defined as the within-subject modulation of EEG ratio indices from EO baseline to VW, expressed as a scalp-resolved percent change. By extending the established logic of physiological reactivity (e.g., eye-opening reactivity) to an ecologically relevant screen perturbation, this index provides a structured approach for quantifying cortical response to screen stimuli and may capture vulnerability that is not evident in resting measures alone. The observed pre–post changes in EO–VW contrast patterns suggest that the intervention altered the participant’s cortical response mode to screen exposure, even in the absence of parallel behavioral improvement.
Our findings suggest that the transition from a resting state to active screen engagement offers a dynamic and stage-dependent biomarker for screen addiction. The observed shift from a pre-intervention "Burnout Response" (where screens activated a fatigued brain) to a post-intervention "Trance Response" (where screens induced prefrontal slowing in a sensitized brain) highlights the utility of SR in characterizing the underlying neurophysiological state of the user. This biphasic model aligns with behavioral observations of recovery and sensitization, offering a potential tool for clinical staging that extends beyond static resting-state measures.
However, the dissociation between physiological recovery and behavioral persistence represents a critical finding. Despite the profound normalization of autonomic and cortical indices, the subject’s core behavioral symptoms – specifically low tolerance for abstinence and oppositional reactivity – remained unchanged or intensified. This underscores a fundamental limitation of 'digital detox' as a standalone intervention: while it successfully restores neurophysiological regulation (ANS and cortical dynamics), it does not automatically remodel the psychosocial patterns – including habit loops, reinforcement learning, and family dynamics – that sustains the addiction.
Therefore, we conclude that while nature-based digital detox is a potent catalyst for physiological restoration, it should be viewed as a prerequisite component of a broader therapeutic strategy rather than a curative endpoint. Effective treatment likely requires integrating physiological resetting with targeted behavioral and family-system interventions to translate restored biological capacity into sustained behavioral self-regulation. Future research should focus on validating the Screen Reactivity index in larger cohorts and dismantling the synergistic effects of nature exposure versus screen abstinence to refine therapeutic protocols.
These conclusions are necessarily provisional. The dataset reflects a single participant, a pre–post observational design, and a bundled intervention that includes multiple physiologically potent exposures beyond reduced screen time (e.g., sustained physical activity, routine restructuring, environmental novelty, and potential altitude-related factors). Consequently, causality cannot be assigned to digital detox alone. Future work should therefore validate the Screen Reactivity Index in cohorts using standardized stimuli, establish test–retest reliability, and link reactivity metrics to behavioral outcomes using validated measures of problematic screen use and inhibitory control. Clinically, the present pattern suggests that physiological recovery may be achievable without concurrent behavioral change, underscoring the need to combine “detox-like” environmental interventions with structured self-regulation and family-based strategies if durable improvements in device-use behavior are the target outcome.
References:
Barry, R. J., Clarke, A. R., Johnstone, S. J., Magee, C. A., & Rushby, J. A. (2007). EEG differences between eyes-closed and eyes-open resting conditions. Clinical Neurophysiology, 118(12), 2765–2773. https://doi.org/10.1016/j.clinph.2007.07.028
Bazanova, O. M., Nikolenko, E. D., & Barry, R. J. (2017). Reactivity of alpha rhythms to eyes opening (the Berger effect) during menstrual cycle phases. International Journal of Psychophysiology, 122, 56–64. https://doi.org/10.1016/j.ijpsycho.2017.05.001
Cash, H., D. Rae, C., H. Steel, A., & Winkler, A. (2012). Internet Addiction: A Brief Summary of Research and Practice. Current Psychiatry Reviews, 8(4), 292–298. https://doi.org/10.2174/157340012803520513
Coyne, P., & Woodruff, S. J. (2023). Taking a Break: The Effects of Partaking in a Two-Week Social Media Digital Detox on Problematic Smartphone and Social Media Use, and Other Health-Related Outcomes among Young Adults. Behavioral Sciences, 13(12), 1004. https://doi.org/10.3390/bs13121004
Dale, R., Haider, K., Majdandžić, J., Hoenigl, A., Schwab, J., & Pieh, C. (2025). The influence of smartphone reduction on heart rate variability: A secondary analysis from a randomised controlled trial. Health Psychology and Behavioral Medicine, 13(1), 2546376. https://doi.org/10.1080/21642850.2025.2546376
Elkin, N., Mohammed Ashraf, A. K., Kılınçel, O., KılınçeL, Ş., Ranganathan, M., Sakarya, A. K., & Soydan, A. M. (2025). Screens and scars: SEM analysis of the relationship between childhood trauma, emotion regulation, and social media addiction. Frontiers in Psychology, 16, 1502968. https://doi.org/10.3389/fpsyg.2025.1502968
Farrukh, S., Reza, S., Babar, S., Alam, M. F., & Imtiaz, M. (2025). From Screens to Serenity: Evaluating the Effect of Digital Detox on Mental and Physiological Health. In Review. https://doi.org/10.21203/rs.3.rs-6572563/v1
Hannon, J., O’Hagan, A., Lambe, R., O’Grady, B., & Doherty, C. (2025). Associations Between Daily Heart Rate Variability and Self-Reported Wellness: A 14-Day Observational Study in Healthy Adults. Sensors, 25(14), 4415. https://doi.org/10.3390/s25144415
Hitt, M. (1995). A Comparison of Three Determinants of an Engagement Index for use in a Simulated Flight Environment.
Ivanova, V., Mitsova, S., Petrova, T., Manolova, V., & Vezenkov, S. (2025). Full Recovery of a 10-Year-Old Girl with Persistent Screen Addiction Since Age 2 and Autism Spectrum Disorder: Case Report. Nootism, 1, 17–26. https://doi.org/10.64441/nootism.1.3.3
Kim, H., Seo, P., Choi, J. W., & Kim, K. H. (2021). Emotional arousal due to video stimuli reduces local and inter-regional synchronization of oscillatory cortical activities in alpha- and beta-bands. PLOS ONE, 16(7), e0255032. https://doi.org/10.1371/journal.pone.0255032
Lemahieu, L., Vander Zwalmen, Y., Mennes, M., Koster, E. H. W., Vanden Abeele, M. M. P., & Poels, K. (2025). The effects of social media abstinence on affective well-being and life satisfaction: A systematic review and meta-analysis. Scientific Reports, 15(1), 7581. https://doi.org/10.1038/s41598-025-90984-3
Lissak, G. (2018). Adverse physiological and psychological effects of screen time on children and adolescents: Literature review and case study. Environmental Research, 164, 149–157. https://doi.org/10.1016/j.envres.2018.01.015
Manolova, V., & Vezenkov, S. (2025a). Are Screen-Induced Synesthesia and Screen-induced Cue-Dependent Behavior Contributing Factors in the Misdiagnosis of ASD Among Children with Screen Addiction? Nootism, 1, 11–16. https://doi.org/10.64441/nootism.1.3.2
Manolova, V., & Vezenkov, S. (2025b). Screen Trauma – Specifics of the Disorder and Therapy in Adults and Children. Nootism, 1(1), 37–51. https://doi.org/10.64441/nootism.2NCSC.3
McEwan, K., Giles, D., Clarke, F. J., Kotera, Y., Evans, G., Terebenina, O., Minou, L., Teeling, C., Basran, J., Wood, W., & Weil, D. (2021). A Pragmatic Controlled Trial of Forest Bathing Compared with Compassionate Mind Training in the UK: Impacts on Self-Reported Wellbeing and Heart Rate Variability. Sustainability, 13(3), 1380. https://doi.org/10.3390/su13031380
Nemeroff, C.B., Alan F. Schatzberg M.D, Natalie Rasgon, M. D. Ph.D, & Stephen M. Strakowski M.D. (2022). The American Psychiatric Association Publishing Textbook of Mood Disorders, Second Edition. American Psychiatric Pub.
Petrov, P., Manolova, V., & Vezenkov, S. (2025). Hidden Family Dynamics in a Case Study of a Child with Screen Addiction, Hyperactivity, and Language Deficits. Nootism, 1(1), 90–95. https://doi.org/10.64441/nootism.2NCSC.10
Petrova, S., Manolova, V., & Vezenkov, S. (2025). Reintroducing Screens: Severe Regression and Symptom Aggravation in Children with ASD/Screen Addiction. Nootism, 1(1), 59–65. https://doi.org/10.64441/nootism.2NCSC.5
Pieh, C., Humer, E., Hoenigl, A., Schwab, J., Mayerhofer, D., Dale, R., & Haider, K. (2025). Smartphone screen time reduction improves mental health: A randomized controlled trial. BMC Medicine, 23(1), 107. https://doi.org/10.1186/s12916-025-03944-z
Queirolo, L., Fazia, T., Roccon, A., Pistollato, E., Gatti, L., Bernardinelli, L., Zanette, G., & Berrino, F. (2024). Effects of forest bathing (Shinrin-yoku) in stressed people. Frontiers in Psychology, 15, 1458418. https://doi.org/10.3389/fpsyg.2024.1458418
Radtke, T., Apel, T., Schenkel, K., Keller, J., & Von Lindern, E. (2022). Digital detox: An effective solution in the smartphone era? A systematic literature review. Mobile Media & Communication, 10(2), 190–215. https://doi.org/10.1177/20501579211028647
Rasmussen, M. G. B., Pedersen, J., Olesen, L. G., Brage, S., Klakk, H., Kristensen, P. L., Brønd, J. C., & Grøntved, A. (2020). Short-term efficacy of reducing screen media use on physical activity, sleep, and physiological stress in families with children aged 4–14: Study protocol for the SCREENS randomized controlled trial. BMC Public Health, 20(1), 380. https://doi.org/10.1186/s12889-020-8458-6
Reid Chassiakos, Y. (Linda), Radesky, J., Christakis, D., Moreno, M. A., Cross, C., COUNCIL ON COMMUNICATIONS AND MEDIA, Hill, D., Ameenuddin, N., Hutchinson, J., Levine, A., Boyd, R., Mendelson, R., & Swanson, W. S. (2016). Children and Adolescents and Digital Media. Pediatrics, 138(5), e20162593. https://doi.org/10.1542/peds.2016-2593
Son, K.-L., Choi, J.-S., Lee, J., Park, S. M., Lim, J.-A., Lee, J. Y., Kim, S. N., Oh, S., Kim, D. J., & Kwon, J. S. (2015). Neurophysiological features of Internet gaming disorder and alcohol use disorder: A resting-state EEG study. Translational Psychiatry, 5(9), e628–e628. https://doi.org/10.1038/tp.2015.124
Stangl, F. J., & Riedl, R. (2024). Neurophysiological Measurements in the Research Field of Digital Detoxing: Review and Implications for Future Research. In F. D. Davis, R. Riedl, J. vom Brocke, P.-M. Léger, A. B. Randolph, & G. R. Müller-Putz (Eds.), Information Systems and Neuroscience (pp. 105–121). Springer Nature Switzerland. https://doi.org/10.1007/978-3-031-58396-4_10
Stefanova, M., Manolova, V., & Vezenkov, S. (2025). ADHD and Screen Addiction in Children Aged 3-9: Staged Recovery and Neurophysiological Markers. Nootism, 1(1), 66–73. https://doi.org/10.64441/nootism.2NCSC.6
Thatcher, R. W. (2010). Validity and Reliability of Quantitative Electroencephalography. Journal of Neurotherapy, 14(2), 122–152. https://doi.org/10.1080/10874201003773500
Thatcher, R. W., Walker, R. A., Biver, C. J., North, D. N., & Curtin, R. (2003). Quantitative EEG Normative Databases: Validation and Clinical Correlation. Journal of Neurotherapy, 7(3–4), 87–121. https://doi.org/10.1300/J184v07n03_05
Thomée, S., Härenstam, A., & Hagberg, M. (2011). Mobile phone use and stress, sleep disturbances, and symptoms of depression among young adults—A prospective cohort study. BMC Public Health, 11(1), 66. https://doi.org/10.1186/1471-2458-11-66
Vezenkov, S., & Manolova, V. (2025a). Screen-Induced Pathological Eye-Covering Reflex in Children with Early Screen Addiction. Nootism, 1(3), 5–10. https://doi.org/10.64441/nootism.1.3.1
Vezenkov, S., & Manolova, V. (2025b). Screen-Induced Pathological Vestibular Reflex: A Specific Marker of Early Screen Addiction. Nootism, 1(2), 5–10. https://doi.org/10.64441/nootism.1.2.1
Vezenkov, S. R., & Manolova, V. R. (2025a). Neurobiology of Autism/Early Screen Addiction Recovery. Nootism, 1, 19–36. https://doi.org/10.64441/nootism.2NCSC.2
Vezenkov, S. R., & Manolova, V. R. (2025b). Screen Addiction – Biomarkers, Developmental Damage and Recovery. Nootism, 1(1), 6–18. https://doi.org/10.64441/nootism.2NCSC.1
Wen, Y., Yan, Q., Pan, Y., Gu, X., & Liu, Y. (2019). Medical empirical research on forest bathing (Shinrin-yoku): A systematic review. Environmental Health and Preventive Medicine, 24(1), 70. https://doi.org/10.1186/s12199-019-0822-8
Zivan, M., Bar, S., Jing, X., Hutton, J., Farah, R., & Horowitz-Kraus, T. (2019). Screen-exposure and altered brain activation related to attention in preschool children: An EEG study. Trends in Neuroscience and Education, 17, 100117. https://doi.org/10.1016/j.tine.2019.100117